Imagine if someone threw the stock market into a time capsule and set the coordinates back in time to January 29, 2020.
Actually, you don’t have to imagine it… Because that’s what seems to have happened. Conditions aren’t just “sort of” similar to this time last year…
They’re identical.
Take a look at this chart of the S&P 500…

After a relentless, three-month-long rally, the S&P sold off some last week. It finished the final trading day of January right on its 50-day moving average (MA – blue line). That’s exactly how it finished in January of last year, as well.
And, if that isn’t odd enough, all of the various technical conditions at the bottom of the chart look exactly the same as last year too. That’s weird, right?
But, hold on. Take a look at this chart of the Volatility Index (VIX)…

While the VIX is trading at a higher level than where it was at last year, the price action is the same. The VIX spent two months chopping back and forth inside a tight trading range. Then, it exploded higher last week.
The VIX closed above its upper Bollinger Band (BB) on Wednesday. Then, it closed back inside the bands on Thursday – generating the first “buy” signal of 2021. But, that buy signal failed when the VIX closed above its upper BB again on Friday. So, now we’re setting up for a rare double-buy signal from the VIX.
|
Free Trading Resources Have you checked out Jeff’s free trading resources on his website? It contains a selection of special reports, training videos, and a full trading glossary to help kickstart your trading career – at zero cost to you. Just click here to check it out. |
That’s what happened last year, too.
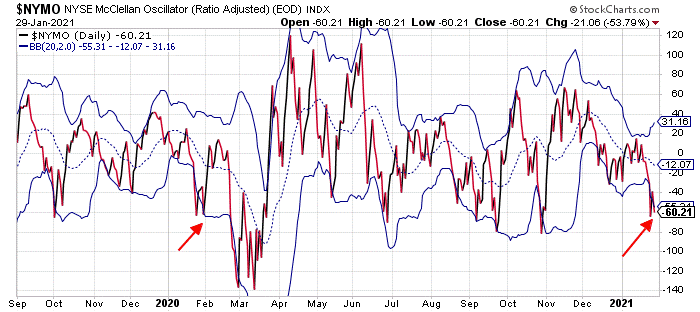
Finally, check out these charts of the McClellan Oscillators (NAMO and NYMO)…


Both of these momentum indicators closed Friday below their lower BBs, and below the -60 level, which indicates an oversold condition. They also closed exactly where they closed at the end of January last year.
So, what does this all mean?
Well, there’s good news and bad news…
The good news is the stock market is now oversold enough that traders can start looking for a bounce. And, it won’t take too much buying pressure to lead the market to new all-time-highs just as it did last February.
The bad news, of course, is that if the similarities to last year continue, then the next rally is likely to create negative divergence on all the various momentum indicators and set the stage for a much more significant decline later this month.
Because that’s also exactly what happened last year.
Best regards and good trading,

Jeff Clark
P.S. Spotting momentum indicators and understanding technical analysis usually intimidates most traders. I can’t always predict the future, but I can understand the signs in the markets – and how they can make me money consistently – and teach you to do the same.
I’ve been using this simple strategy for over three decades to quickly make money using just three stocks over and over again. Read all about it in my 3-Stock Retirement Blueprint, and how it could help set you up for a comfortable retirement like it did for me.
Reader Mailbag
Has looking for similar patterns in the market helped you lock in gains recently? Do you think it will move lower as expected?
Let us know your thoughts – and any questions you have – at [email protected].
