
Managing Editor’s Note: Today, we’re hearing from our contributing editor Mike Burnick in his weekly Thursday feature.
Mike has over 30 years in the investment and financial services industry – from operating as a stockbroker, trader, and research analyst, to running a mutual fund as a registered investment advisor and portfolio manager, to being Research Director for the Sovereign Society, specializing in global ETF and options investing.
And he’s been senior analyst at TradeSmith for three years, running Constant Cash Flow, Infinite Income Loop, and Inside TradeSmith.
Here’s Mike…
It’s a bird… it’s a plane… no, it’s a cross of gold for the S&P 500!
Just in time for July 4th fireworks, the S&P 500 notched a golden cross last week.
That’s when the 50-day moving average of price crosses above the 200-day average. And it has been a reliable bullish indicator.
But there’s a fly in the ointment that could ruin the stock market’s post-July 4th picnic…
You see, the stock market is already extremely overbought. And while that doesn’t cancel out the golden cross, it sure makes me wary about the market right now.
Here’s why…
Moving averages are just one of many technical indicators. And it’s a lagging indicator at that. That’s because it looks back at the market’s price action over the past 50 and 200 days.
Another indicator I personally put a lot of stock in (pardon the pun) is Bollinger Bands (BB). It displays a range of highs and lows over time, typically a 20-day moving average of prices.
But BB gives you a valuable extra piece of analysis. It plots the trading range of a stock or index in terms of standard deviations around the 20-day moving mean, or average price.
With that extra bit of intel, you know when a stock or index is overbought (when price is 2 standard deviations above the average) or oversold (2 standard deviations below the average).
And that extra bit of info is gold, because it often tells you when to expect a reversal in trend.
Let’s face it, stocks don’t move up (or down) in a straight line. That would be too easy to trade, making us all billionaires.
Instead, stocks trace out a saw-tooth pattern of ups and downs. Two steps up and one step back, or vice versa. That’s a reversal.
And the longer a stock or index trends in one direction, the more overbought or oversold it becomes, and the more likely a reversal in trend in the other direction.
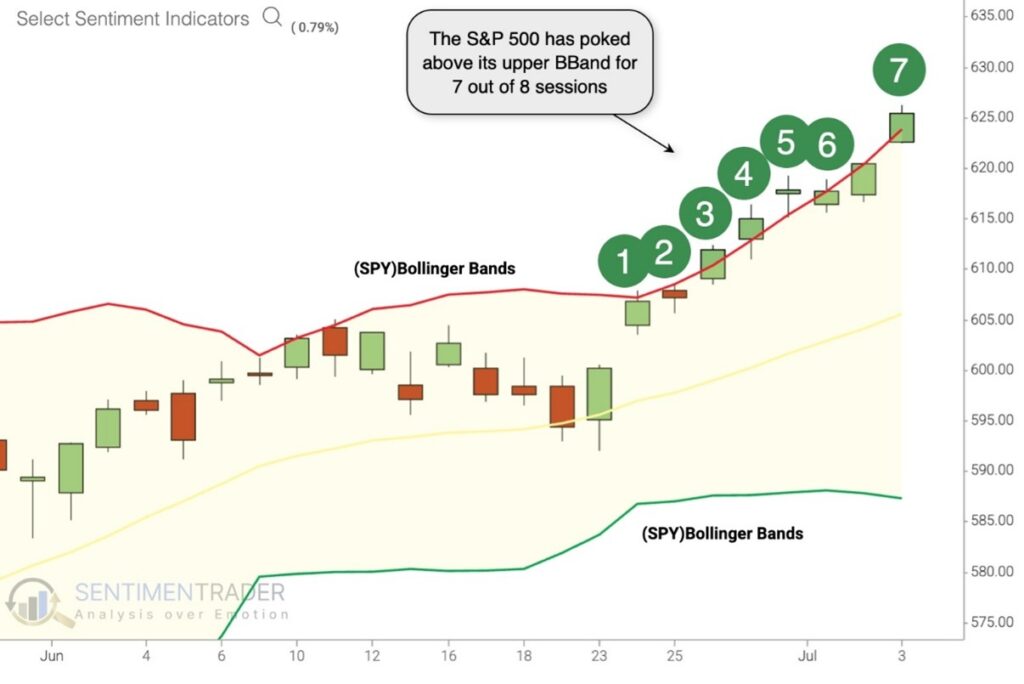
I bring up this technical analysis tutorial because the S&P 500 Index just traded above its upper BB for eight straight days, before pulling back the past few days, as you can see above.
You might think positive momentum like this is a bullish sign, but the exact opposite is true.
It means the entire stock market is extremely overbought right now, and vulnerable to a downside reversal at any time.
Take a closer look at the historical data over the last 60 years and you’ll see for yourself that S&P 500 returns were below average in the days and weeks ahead.
Stocks were up only 55% of the time three weeks later. Even four months later the S&P 500 is still up just 59% of the time – barely better than coin-flip odds – and stocks posted average gains of a meager 1.6%!
Mike Burnick’s Bottom Line: Stocks had a great run off the tariff turmoil lows in April. But it seems to me they’ve gone too far, too fast, and for too long in one direction. So, stay alert for a possible downside reversal at any time.
Good investing,

Mike Burnick
Contributing Editor, Market Minute