
Managing Editor’s Note: Today, we’re hearing from our contributing editor Mike Burnick in his weekly Thursday feature.
Mike has over 30 years in the investment and financial services industry – from operating as a stockbroker, trader, and research analyst, to running a mutual fund as a registered investment advisor and portfolio manager, to being Research Director for the Sovereign Society, specializing in global ETF and options investing.
And he’s been senior analyst at TradeSmith for three years, running Constant Cash Flow, Infinite Income Loop, and Inside TradeSmith.
Here’s Mike…
These Three Indicators Tell Me the Nasdaq Uptrend Is Under Pressure
BY MIKE BURNICK, CONTRIBUTING EDITOR, MARKET MINUTE
Since the April tariff-turmoil lows, stock market breadth has been excellent confirming the strong uptrend in stocks since then.
I always keep a watchful eye on breadth measures as a way to check on the market’s health under the hood.
This includes the difference in advancing vs. declining stocks, new highs vs. new lows, and the percentage of stocks in the index that are in healthy uptrends.
Well, last week three market breadth indicators I follow turned down, after prolonged winning streaks. So, under the hood, stock market internals maybe aren’t firing on all cylinders.
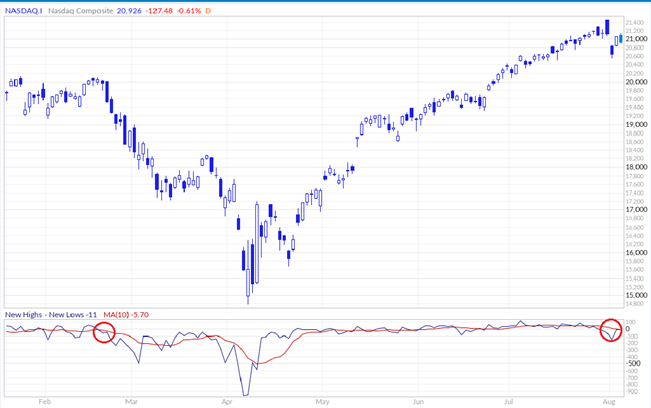
First, as you can see above, the number of stocks hitting new one-year highs outpaced those making new lows for 30 straight days.
But that win-streak came to an end with last week’s market pullback.
Second, the technology sector had been on a stellar win streak of its own, trading one standard deviation above its 50-day price moving average for a stunning 55 straight days.
That streak also ended with Friday’s pullback.
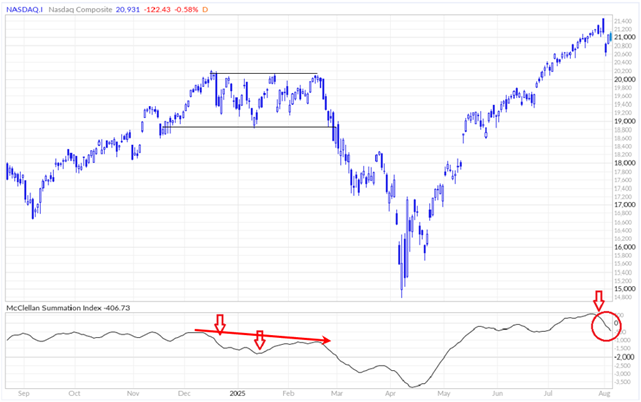
Third, as you can see above, the Nasdaq McClellan Summation Index has clearly turned down. I watch this indicator closely because it compares the average of advancing vs. declining stocks over different time periods.
It’s a handy measure that shows you both the cumulative breadth and trend strength of the index.
So, when the summation index above is moving up from left to right, it signals a healthy uptrend for Nasdaq.
But when the index rolls over and begins to decline, it’s telling you the Nasdaq’s strong uptrend is losing momentum.
Keep in mind, none of these breadth indicators give you a reason to bail on stocks immediately. But it certainly gets my attention – telling me there’s a possible disturbance in the force of the market’s trend.
That’s especially true for the tech-heavy Nasdaq index. That’s because Nasdaq has led the market higher since the April low.
But these stocks are extremely overbought, and now cracks are showing up in the foundation of the rally.
Just before the big tariff-turmoil market selloff in March and April, the number of new highs minus lows on Nasdaq went negative in mid-February.
Also, the Nasdaq McClellan Summation Index turned down even earlier, and kept falling, even though Nasdaq itself moved sideways in a trading range.
These were clear warning signs of trouble ahead back then, and sure enough, Nasdaq fell 27% over the next month and a half.
Now we’re getting these same warning signs again.
Bottom line: The decline in breadth tells me the uptrend in market-leading Nasdaq stocks may be under pressure. It could resolve itself in one of two ways: either a sideways trading range pause, or a steeper pullback in stocks. Now is the time to be prepared either way in advance.
Good investing,

Mike Burnick
Contributing Editor, Market Minute