
Investors got a jolt last Friday as markets careened lower in a selling stampede. This includes both stocks and cryptocurrencies.
The catalyst was renewed trade war turmoil as the White House threatened additional 100% tariffs on China along with technology export restrictions.
That news didn’t sit well with stocks, especially the high-beta variety (think tech, telecom, AI-related, etc.).
As a result, the S&P 500 lost 2.7%, the tech-centric Nasdaq 100 dropped 3.5%, and the Magnificent 7 plunged nearly 4%.
Averaging it out, let’s call it a -3% down day. The first single-day loss of this magnitude since – you guessed it – April’s tariff turmoil.
Now, where we go from here is the trillion-dollar question…
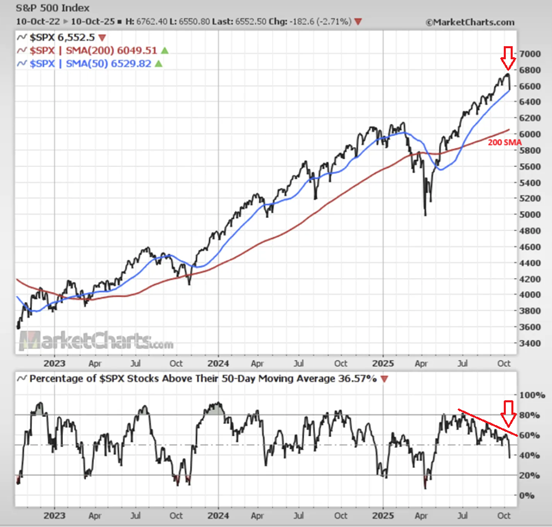
As you can see above, the S&P 500 is still about 10% above its 200-day moving average line. Most other indexes are similarly stretched to the upside.
Worse, as you can see in the lower panel of the chart above, the share of S&P component stocks above their own 50-day moving average line plunged below 40%. That prolongs an ominous downtrend that began in July.
Most of the time, when this key breadth indicator falls below the 50% mark, it ends up making a round-trip down to 20% or less before stocks are truly oversold.
Bottom line: As Jeff and I have been pointing out for a while now, the stock market reached extremely overbought levels and is overdue for a pullback. This could be just the start, but the clock is ticking. TradeSmith seasonality tools indicate an uptrend should begin soon. The question is, does the typical year-end rally start now, or from much lower levels?
Good investing,

Mike Burnick
Contributing Editor, Market Minute