
Today, I’m going to share some unconventional wisdom that should change the way you approach trading.
You might be a little skeptical at first.
But I can assure you… by using it, you’ll be able to double your money over and over no matter what kind of market we’re in.
In fact, it’s especially effective in emotionally charged bear markets like we’re currently in.
Try thinking of trading the way I do… A chart of a stock (or index) is simply an emotional picture of the stock at a specific moment in time.
Stock charts tell me how traders and investors are responding emotionally at any given point in time.
Human emotions are remarkably consistent. We tend to respond the same way, over and over again, to the same circumstances.
In the same way, the market is emotional. It evolves over time.
So, conditions that used to provide a catalyst for a big move may need to get more extreme to cause a similar movement the next time.
Think about it this way…
When I first got married, I’d often come home from work, take off my socks, and drop them on the floor next to the couch in the living room. My wife would come home, see my socks on the floor, and get all ticked off about it.
In other words, she’d have an emotional reaction to her husband leaving his socks in the middle of the living room floor.
This happened over and over again.
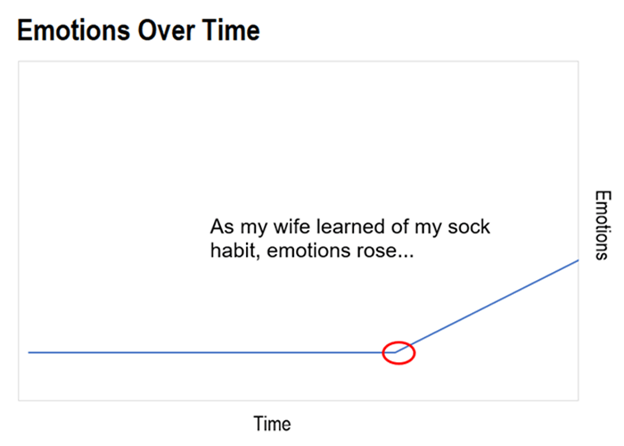
Now, think of how this reaction would look on a typical stock chart…
It’d start with a line trending sideways – my wife’s emotions before she knew all about my sock habit. You’d see the line climb as my wife got more and more frustrated…
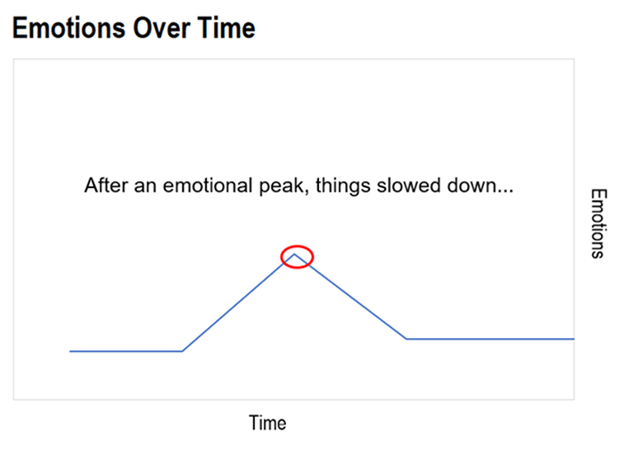
Eventually, though, my wife got a little better about dealing with her slob of a husband, and I got a little better about not leaving my socks next to the couch.
Leaving my socks on the floor no longer elicited the same reaction from my wife.
She still had the same emotions. But she had adapted. She had evolved.
She suppressed her emotions and would need a bigger catalyst before getting upset with me again…
Over on the chart, things have calmed down.
The line on the chart is headed sideways, with little action in either direction. There’s less volatility.
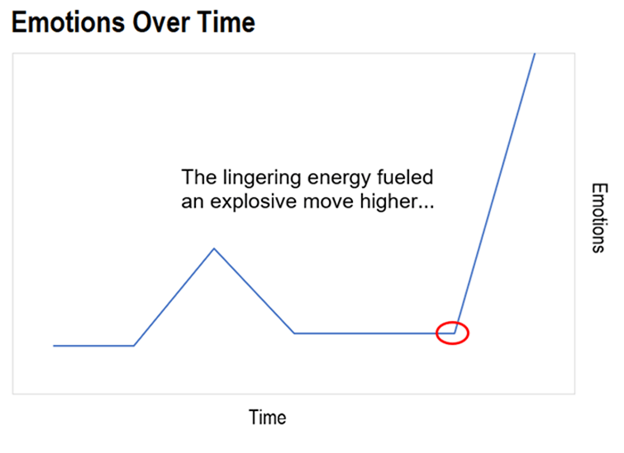
But in the background, energy is building. Those dirty socks had to be going somewhere… and it wasn’t the hamper.
Remember, human emotions don’t change. They’re remarkably consistent. But emotions do evolve and sometimes it takes a bigger catalyst to elicit the same response.
That catalyst was provided when my wife was vacuuming one day and moved the sofa to vacuum the carpet beneath it.
She found about a dozen pairs of my dirty socks tucked beneath the couch.
Boom!
You can guess what happened next on the chart…
Here’s my point…
A stock chart is simply the emotional representation of investors’ reactions to the stock.
If you know how to spot the right catalyst, you can make a killing as the pattern plays out… and avoid holding the bag when stocks sell off hard.
Best regards and good trading,

Jeff Clark
Editor, Market Minute
Free Trading Resources
Have you checked out Jeff’s free trading resources on his website? It contains a selection of special reports, training videos, and a full trading glossary to help kickstart your trading career – at zero cost to you. Just go here to check it out.