
Managing Editor’s Note: Today, we’re hearing from our contributing editor Mike Burnick in his weekly Thursday feature.
Mike has over 30 years in the investment and financial services industry – from operating as a stockbroker, trader, and research analyst, to running a mutual fund as a registered investment advisor and portfolio manager, to being Research Director for the Sovereign Society, specializing in global ETF and options investing.
And he’s been senior analyst at TradeSmith for three years, running Constant Cash Flow, Infinite Income Loop, and Inside TradeSmith.
Here’s Mike…
Why Oil Prices May Not Stay Higher for Longer
BY MIKE BURNICK, CONTRIBUTING EDITOR, MARKET MINUTE
The S&P 500 has made zero progress on the upside this year, stuck in a trading range between roughly 6700 and 7000.
Market valuations are elevated and the market is now digesting big gains over the last three years by moving sideways.
That makes stocks vulnerable to a pullback.
Then we got a sudden spike in oil prices to $120 a barrel.
The war with Iran and the surge in oil prices that quickly followed throws a monkey wrench into the stock market trend.
Higher oil means higher prices for everything from gas for the family car, to even higher diesel and jet fuel prices, raising transport and travel costs and potentially slowing the economy.
If sustained, this would eventually lead to higher inflation. And that part of the equation really makes stock investors nervous.
That triggered the S&P 500 to break badly, falling below the low end of that trading range.
But just how sustainable are higher oil prices?
Well, that’s anyone’s guess, and the media are busy throwing out their best guesses about how long the war lasts, and how high oil could go.
But it’s just that … guesswork.
Rather than guessing, I trust in the message from the hard data. In fact, that is what TradeSmith is all about.
And according to the hard data from oil markets shown below, the market is saying oil prices may not stay high for all that long.
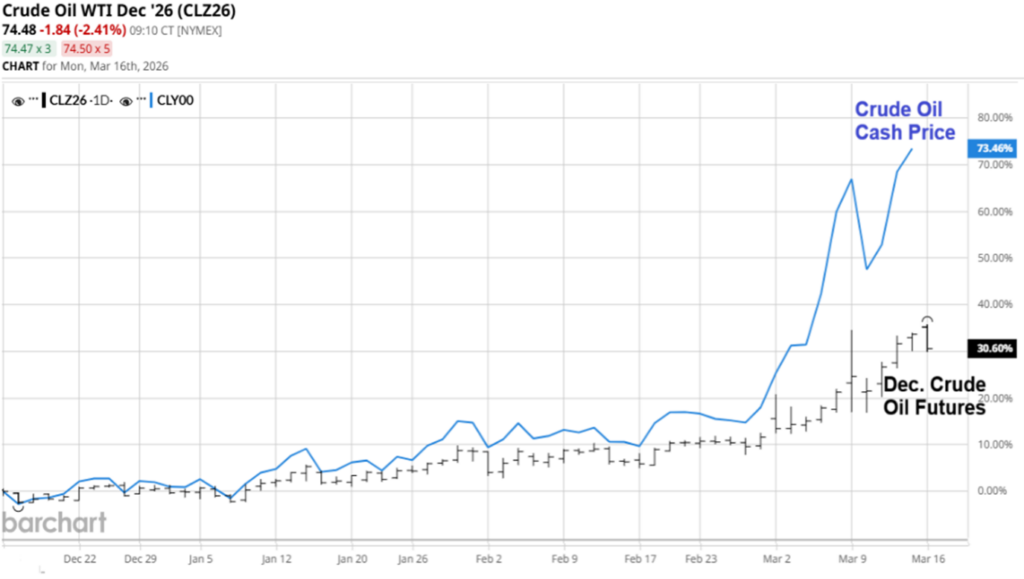
The chart shows spot – aka cash – oil prices (solid blue line) compared with the December 2026 oil future price (black bars).
What jumps out at me right away is the unusually large spread between current spot prices and the futures price at year end.
While spot oil prices are hovering near $100, the December future price is just $75.
That’s not much higher than before the war with Iran, up less than 20% in fact.
This compares to a 50%+ move higher in spot oil prices.
The wide spread between spot and futures pricing means one thing: Markets, where thousands of investors have real money on the line, are telling us that oil prices won’t stay higher for longer.
They’re likely to be back down to the mid $70s by year end, if not well before then.
If that’s the case, then the recent runup in energy stocks may also be short lived.
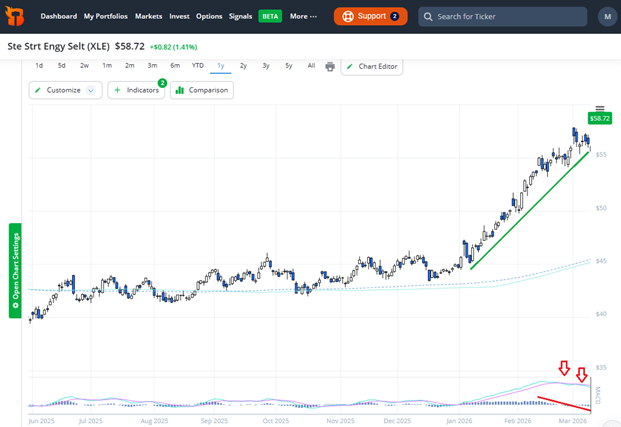
In this TradeSmith chart of the SPDR Energy Sector ETF (XLE) you can see the big move in energy stocks, up nearly 30% this year.
The recent runup since the war started extended what was already becoming an overbought move higher in XLE.
In the lower panel you can see the MACD (Moving Average Convergence Divergence) indicator. It’s one of my favorite momentum indicators, and it’s one that Jeff Clark also uses daily in finding and evaluating trades for his subscribers.
It basically measures the difference between two moving averages of price.
When price and the MACD lines are in sync higher, it means upside momentum is in gear too.
But when MACD diverges with price, as it is right now for XLE, that means the trend is losing momentum, and a reversal may be near.
You can see MACD made new highs along with the price of XLE in late February, indicating solid upside momentum.
But on the recent move up fueled by higher oil prices, XLE price moved up, but MACD moved down.
That negative divergence tells me momentum for energy stocks is fading fast. So, I don’t have too much faith in the rally continuing.
Good investing,

Mike Burnick
Contributing Editor, Market Minute