
Earnings season starts next week. So, once again, once again, it’s time to follow the banks.
The action in bank stocks tends to lead the action in the broad stock market – especially during earnings season. When the banks are strong, the market rallies. When the banks are weak, so is the stock market.
That was the case last quarter. Strength in the KBW Bank Index (BKX) in early January helped to keep the broad stock market propped up into February. Then, once the bank stocks rolled over and started to fall, the broad stock market followed along.
Now, with the broad stock market in “correction mode,” the big bank influence is even more important.
The major money center banks are scheduled to report earnings starting next week. The market’s reaction to those reports will set the tone for this earnings season.
The banking sector has come under pressure in recent weeks. BKX trades about 10% lower than when it peaked in mid-February. And, that action has some financial television talking heads wondering if the banks might come under even more selling pressure as they report earnings.
On the flip side, the bullish percent index for the financial sector (BPFINA) generated a buy signal two weeks ago. And, that signal still has plenty of room to run higher.
So, we have conflicting indicators.
Let’s look at the chart of BKX and see if we can get a better read on its next potential move…
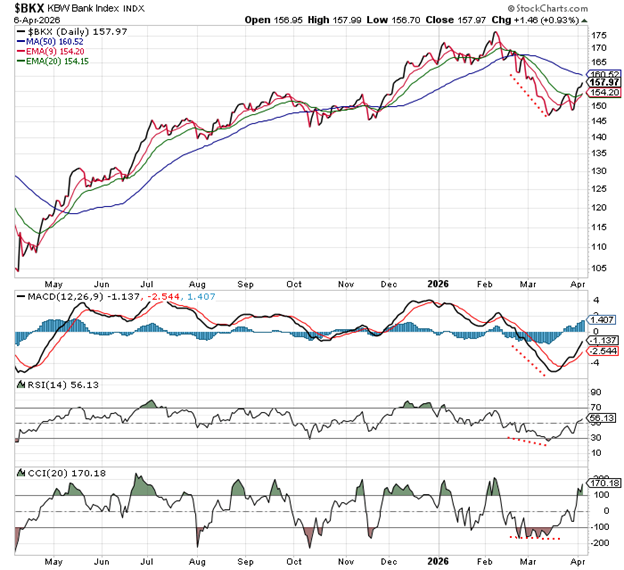
The February-March decline was a straight shot lower – with BKX making a number of lower highs and lower lows. By mid-March, BKX was oversold enough to justify a bounce. And, that bounce has played out over the past three weeks.
The problem with this chart, though, is that as BKX was hitting its low three weeks ago, all the momentum indicators at the bottom of the chart were hitting new lows as well. In other words, there wasn’t any “positive divergence” to suggest the final bottom was being formed. So, any oversold bounce would likely be temporary. And, BKX would need to dip back down at least one more time in order to establish a better bottom.
BKX is now approaching the resistance of its 50-day moving average line. Meanwhile, the momentum indicators have pulled up out of oversold territory and are now neutral. There’s probably not enough energy left for BKX to power through its 50-day MA. So, this is a logical area to look for the bounce to end, and for BKX to turn lower and head back down towards its March low.
If BKX makes a new low (below $147) there’s an excellent chance the momentum indicators will make higher lows. In that case, the chart will have the sort of “positive divergence” that is often an early warning sign of an impending rally.
Let’s keep an eye on this chart for now. If BKX declines going into the big-bank earnings reports next week, it may set the stage for a rally following those reports.
And, if the bank sector rallies, then the broad stock market will likely follow along.
Best regards and good trading,

Jeff Clark
Editor, Market Minute
Free Trading Resources
Have you checked out Jeff’s free trading resources on his website? It contains a selection of special reports, training videos, and a full trading glossary to help kickstart your trading career – at zero cost to you. Just go here to check it out.