
Listen to the audio version of this article (generated by AI).
Managing Editor’s Note: Today, we’re hearing from our contributing editor Mike Burnick in his weekly feature.
Mike has over 30 years in the investment and financial services industry – from operating as a stockbroker, trader, and research analyst, to running a mutual fund as a registered investment advisor and portfolio manager, to being Research Director for the Sovereign Society, specializing in global ETF and options investing.
And he’s been senior analyst at TradeSmith for three years, running Constant Cash Flow, Infinite Income Loop, and Inside TradeSmith.
Here’s Mike…
Why Seasonality Could Lead Stocks Lower This Summer
BY MIKE BURNICK, CONTRIBUTING EDITOR, MARKET MINUTE
Back in my high school football days it was all about “X’s” and “O’s.”
Our head coach literally drew up plays on the locker room chalkboard with those letters, expecting us to memorize it.
But in the investment game, it’s all about “V’s” and “W’s.”
Because those are the letter-shaped patterns traders frequently see when a stock – or the entire market – makes a bottom.
At least W bottoms used to be a frequent pattern in markets. But in recent years it’s been mostly about “V’s.”
In fact, most stock market pullbacks since the Covid crash in 2020 have formed a V bottom. That’s when prices plunge straight down, hit a low, then surge straight up again.
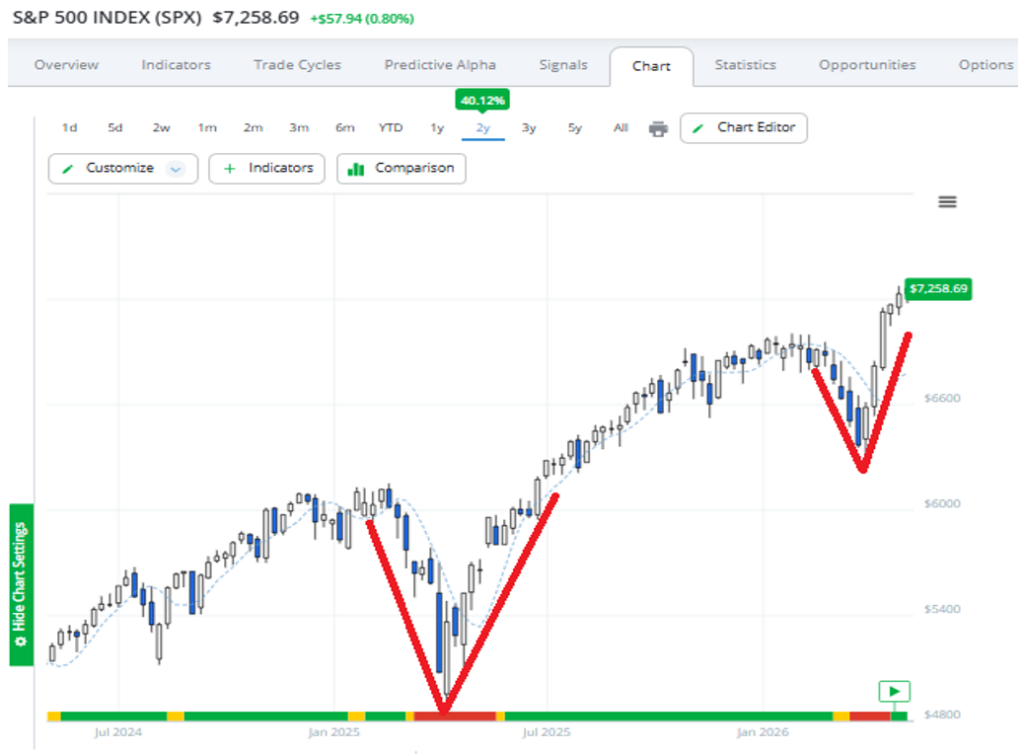
The lows in 2025 and again this year were V’s.
One problem with V-shaped market lows is that you don’t have much time to buy stocks at discounted prices before they rebound.
A bigger problem is that investors get conditioned to expect ALL market lows to be V-shaped.
And while that has been the case recently, it is definitely not the norm longer term.
In fact, going back to the 1950s, most significant market lows look more like W’s. That’s a letter that traders like better.
In a W-shaped bottom, prices usually strike a low, bounce higher (but short of the old high) then retest the initial low. This gives you more time to buy on the second dip that forms the W.
I bring up this “alphabet soup” of stock patterns because sooner or later, stock selloffs won’t end with a quick V. And you should be well aware of it.
It’s possible that the recent V bottom in March could morph into something else entirely.
And according to our TradeSmith Seasonality indicators, that could be a high probability.
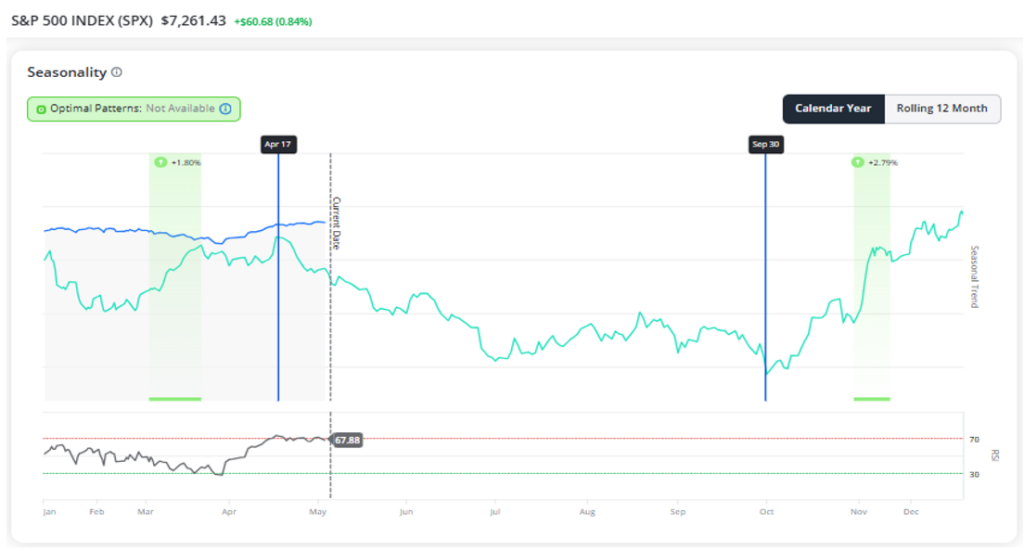
Taking a closer look at our Trade Cycles Seasonality chart shown above, you can see that mid-term elections have not been kind to stocks, especially during May through October.
The S&P 500 is up just over 52% of the time during this period, with a median loss of -3.55%.
That is most likely due to the typical election year uncertainty. Or perhaps the negative campaigning that takes place in the months leading up to it.
Either way there is certainly more uncertainty for investors to ponder heading into the 2026 election.
First, there is the unresolved war with Iran. That pushed oil prices above $100, igniting inflation concerns again.
The Federal Reserve is reluctant to cut interest rates as a result. And the Fed itself, like Congress, is soon to be in transition with a new Fed chair taking the helm.
Bottom line: I hope that you have followed Jeff’s guidance and our TradeSmith tools to help you make money off the March V-shaped low. But now may be a good time to take some profits and tighten your stops. Remember, not all market bottoms are V’s… and mid-term years often include a summertime slump.
Good investing,

Mike Burnick
Contributing Editor, Market Minute