
Listen to the audio version of this article (generated by AI).
Jeff’s note: If you joined me for my 12 Trades to $1 Million Challenge event last Thursday, thank you! We got a fantastic response from Market Minute and TradeSmith readers.
I’m told 3,259 of you joined me to hear all about my first-ever trading challenge.
If you missed it, don’t worry. We’ll be accepting new participants until midnight tonight.
So, there’s still time to check out what’s it’s all about… and how we’ll attempt to trade our way to $1 million using my time-tested options strategy in 12 trades or less with just a small starting stake.
We’re In For High Volatility…
BY JEFF CLARK, EDITOR, MARKET MINUTE
Periods of low volatility are always followed by periods of high volatility, and vice versa.
That’s what makes the current market environment potentially dangerous. We’ve had a low-volatility market for the past few weeks. And now, it looks like that’s about to change.
Look at this chart of the Volatility Index (VIX) along with its Bollinger Bands…
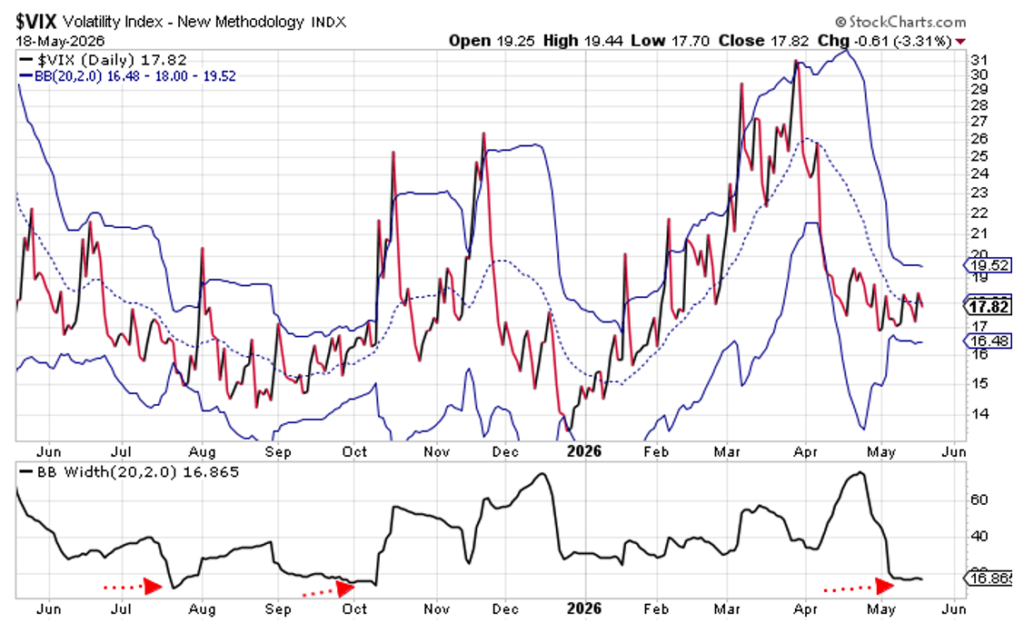
When applied to a stock or an index, Bollinger Bands help to identify the most probable trading range. When applied to the VIX, however, the Bollinger Bands indicate periods of contraction – when the stock market is calm and investors are complacent – and expansion – when the markets are volatile and investors are fearful.
For the past month, the stock market has been moving higher, investors have been complacent, and the VIX has been in a relatively tight trading range. This action has allowed the Bollinger Bands to pinch together, building up energy to fuel the next expansion phase.
The indicator at the bottom of the chart shows the width of the Bollinger Bands. The indicator has fallen below “20.” That’s about as narrow as the bands have been any other time over the past year. This is a condition that happens when we’ve been through a period of low volatility.
Remember, though, what I wrote above – “Periods of low volatility are always followed by periods of high volatility.”
Look at this chart of the S&P 500 and notice what happened the previous two times the Bollinger Band width dipped below 20, last July and last October…
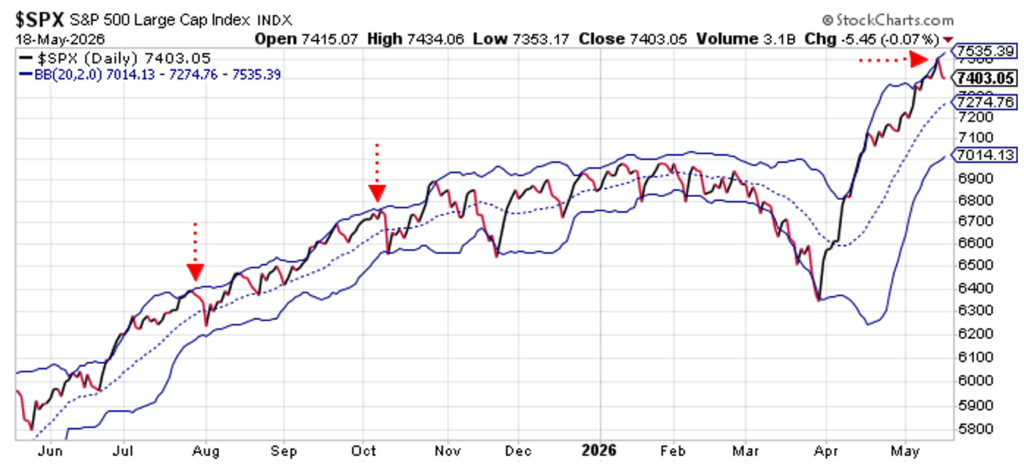
In both cases, the S&P 500 was trading near its upper Bollinger Band. And, in both cases the market got hit with short-term selling pressure that knocked the index down to its lower Bollinger Band.
Similar action today would lead to a move towards 7100 or so on the S&P 500. That’s barely a 5% decline from the all-time high the index posted last week.
Though, I suspect it would feel worse than that to many investors – especially for those who are leveraged and betting aggressively on a continued move higher in the market.
It looks to me like the recent period of low volatility is about to morph into a period of high volatility. Traders who are over-exposed should consider trimming positions a bit.
And, folks who are looking to add money to the market might be better off waiting a couple of weeks. I suspect the S&P will be lower towards the end of the month than where it is today.
Best regards and good trading,

Jeff Clark
Editor, Market Minute
Free Trading Resources
Have you checked out Jeff’s free trading resources on his website? It contains a selection of special reports, training videos, and a full trading glossary to help kickstart your trading career – at zero cost to you. Just go here to check it out.