
Listen to the audio version of this article (generated by AI).
Managing Editor’s Note: Today, we’re hearing from our contributing editor Mike Burnick in his weekly feature.
Mike has over 30 years in the investment and financial services industry – from operating as a stockbroker, trader, and research analyst, to running a mutual fund as a registered investment advisor and portfolio manager, to being Research Director for the Sovereign Society, specializing in global ETF and options investing.
And he’s been senior analyst at TradeSmith for three years, running Constant Cash Flow, Infinite Income Loop, and Inside TradeSmith.
Here’s Mike…
Momentum for This Critical AI Supplier is Fading Fast r
BY MIKE BURNICK, CONTRIBUTING EDITOR, MARKET MINUTE
Don’t look now but the AI trade is eating the stock market.
And it is sucking all light and life out of the rest of the stock market.
For me, this all looks familiar. It’s uncomfortably similar to the dot.com bubble in the late 1990s.
Back then it was computer networking stocks like Cisco (CSCO) that were booming by supplying servers that fed the dot.com trade.
I can recall CSCO shares gaining 50%-60% in just a month during that mania 25 years ago.
Today, semiconductor stocks like Micron (MU) are soaring as the key supplier to the AI-trade.
MU is up over 100% in just the past month!
Folks, that’s just not normal stock market behavior, even if AI is going to change the world as we know it.
The recent rally may look strong, but beneath the surface just a handful of mega-cap technology stocks account for most of the gains.
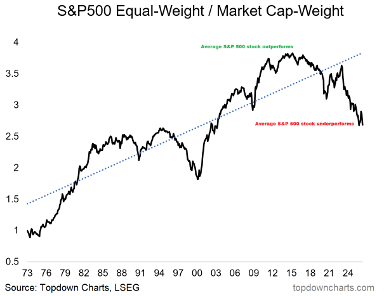
This can easily be seen in the chart above.
It tracks the S&P 500 Equal Weight Index, where all stocks count the same, divided by the market-cap weighted S&P 500, where just a few stocks dominate.
The equal weight index is a better representation of the “average” stock.
When the line rises, the average stock outperforms the index. And when it falls, the average stock underperforms the index.
Right now, the S&P 500 is outperforming the average stock by a very wide margin. It’s even more lopsided since the March low!
That’s a big red flag for a continuation of this rally, but it’s not the only one.
Jeff Clark and I are both big believers in momentum, especially when you spot divergences that could signal a change in trend.
And when momentum starts to diverge from price, it’s an even bigger red flag of a likely reversal.
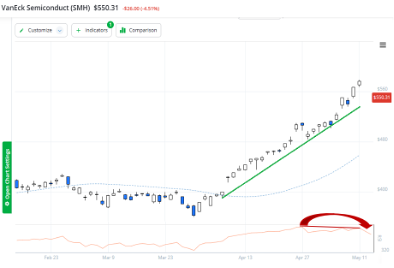
As you can see above, the Semiconductor Index ETF (SMH) just posted a parabolic move, up 60% just since the March low.
Trouble is, the Relative Strength Index – RSI (lower panel in the chart above), stopped going up in April and has been rolling over.
RSI is key measure of momentum. And what you see above is a classic negative divergence, with the price of semiconductor stocks going up and momentum fading fast, at the same time.
Bottom line: The main supplier to the AI-trade – semiconductors – are quickly losing upside momentum. It could be just a temporary dip for chip stocks. Or it could mean the start of a much larger and deeper correction. After a 60%+ gain for semiconductor stocks in just a month, a correction seems overdue.
Good investing,

Mike Burnick
Contributing Editor, Market Minute