
Listen to the audio version of this article (generated by AI).
Managing Editor’s Note: Today, we’re hearing from our contributing editor Mike Burnick in his weekly feature.
Mike has over 30 years in the investment and financial services industry – from operating as a stockbroker, trader, and research analyst, to running a mutual fund as a registered investment advisor and portfolio manager, to being Research Director for the Sovereign Society, specializing in global ETF and options investing.
And he’s been senior analyst at TradeSmith for three years, running Constant Cash Flow, Infinite Income Loop, and Inside TradeSmith.
Here’s Mike…
Watch Out for a June Market Swoon
BY MIKE BURNICK, CONTRIBUTING EDITOR, MARKET MINUTE
Recently I pointed out that Energy seasonality is about to turn negative, in spite of oil prices still hovering near $100 a barrel.
But what about overall stock market seasonality?
Let’s take a closer look at our Trade Cycles indicators to see where seasonal trends stand for the S&P 500 Index.
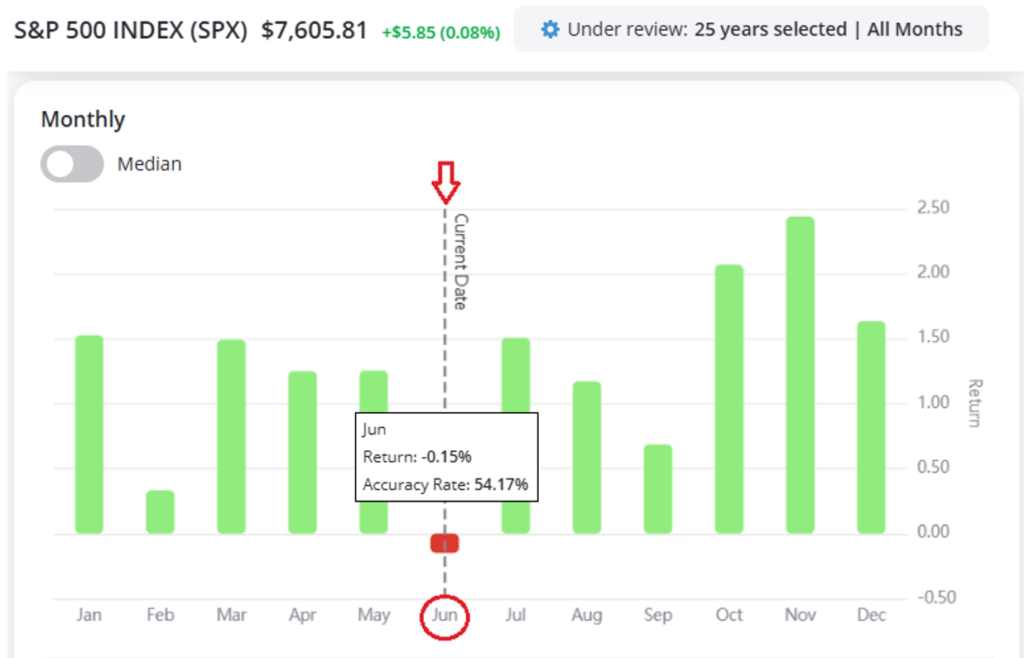
As you can see above, the month of June has not been very good to investors over the last 25 years. The S&P 500 is down 54% of the time this month, posting negative median returns of -0.15%.
The good news is that stocks typically enjoy a stronger seasonal rebound in July.
Also, the month of June tends to show a pattern of good initial gains in the first week, followed by lackluster returns in weeks 2 and 3, followed by a larger drop in week 3.
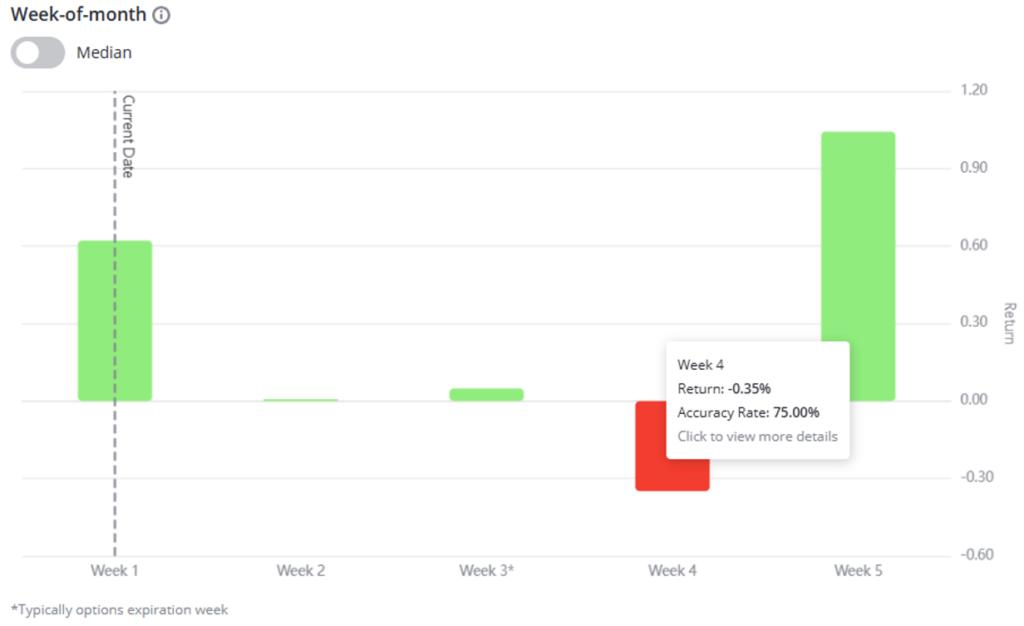
This is often the week right after monthly options expiration in June (6/18 this year), which is also a triple-witching event.
That means quarterly expiration for stock options, stock index futures, and stock index options—all on the same day.
So, any market weakness this month could show up between next week, and the week ending June 26.
This year is also a mid-term election year. This has historically produced a more distinct trading pattern than the average year. And it’s another reason for caution.
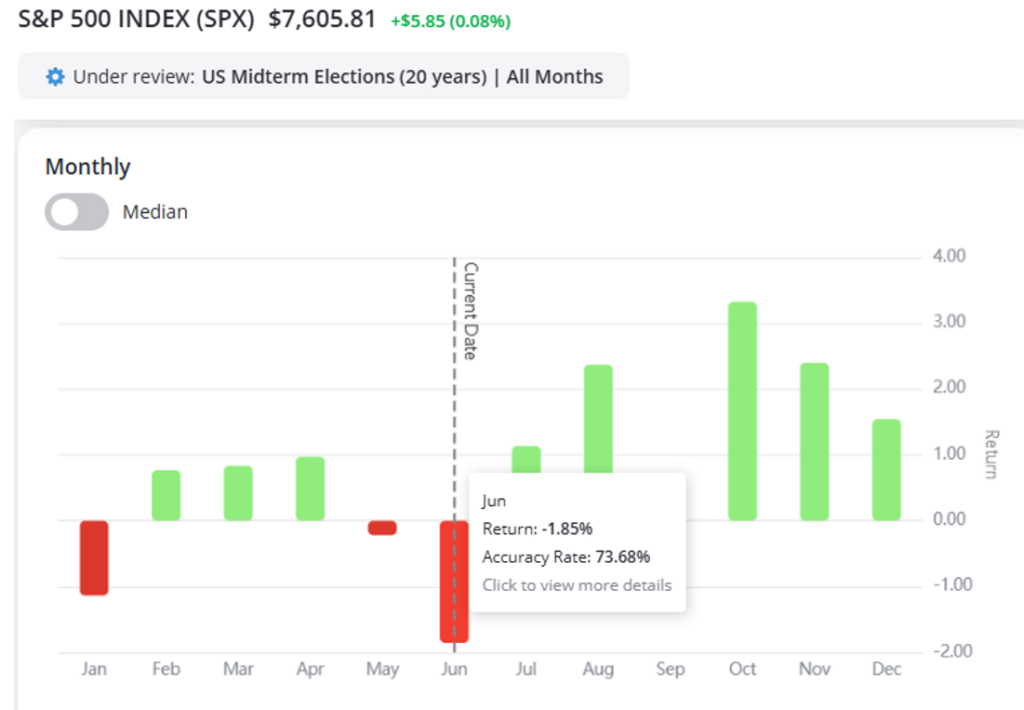
The seasonal data show June tends to be even worse during mid-term years, down 73.68% of the time and posting median losses of -1.85% in mid-term years since 1950.
The best June performance in mid-term years was 1998 at +3.9% but the worst in 2002 was -9.2%!
Bottom line: According to our Trade Cycles seasonality data, you should keep a watchful eye out for a possible stock market pullback in the weeks ahead, prior to a July rebound.
Good investing,

Mike Burnick
Contributing Editor, Market Minute