
Listen to the audio version of this article (generated by AI).
Managing Editor’s Note: Today, we’re hearing from our contributing editor Mike Burnick in his weekly feature.
Mike has over 30 years in the investment and financial services industry – from operating as a stockbroker, trader, and research analyst, to running a mutual fund as a registered investment advisor and portfolio manager, to being Research Director for the Sovereign Society, specializing in global ETF and options investing.
And he’s been senior analyst at TradeSmith for three years, running Constant Cash Flow, Infinite Income Loop, and Inside TradeSmith.
Here’s Mike…
How to Find Stocks in the Seasonal Sweet Spot for July Gains
BY MIKE BURNICK, CONTRIBUTING EDITOR, MARKET MINUTE
June was a rough month for stocks.
The S&P 500 slid 1% while the tech-heavy Nasdaq dropped 6% in June.
But it’s a new month, and our Trade Cycles Seasonality indicators point to higher stock prices in July.
Subscribers can access our valuable Seasonality statistics by simply clicking on the TradeSmith Finance Home page, then scrolling down to Seasonality.
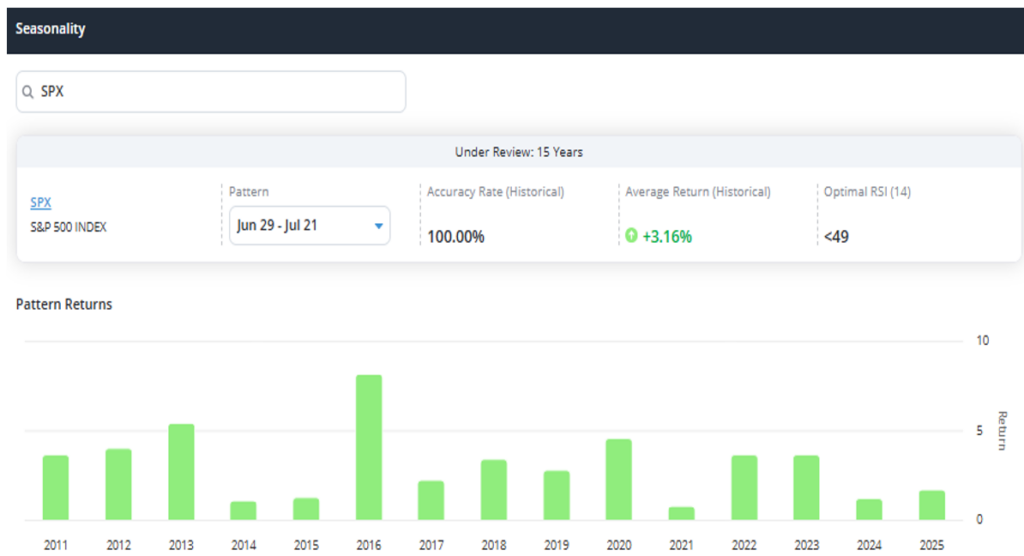
In the image above, you can see the historical seasonality for the S&P 500 (SPX) over the past 15 years.
Our indicators display a bullish seasonal window for stocks that opened last week (June 29) and runs through July 21.
During this seasonal period, the S&P 500 has been up 100% of the time over the last 15 years, posting average gains of 3.16%!
So, even though stocks suffered a June swoon, the market typically rebounds in July. In fact, it’s one of the best months of the year to be invested in stocks historically.
And by using our TradeSmith Screener, we can dig a bit deeper into summer seasonality, and zero in on the best S&P 500 stocks to own for a potential July rebound rally.
Here’s how…
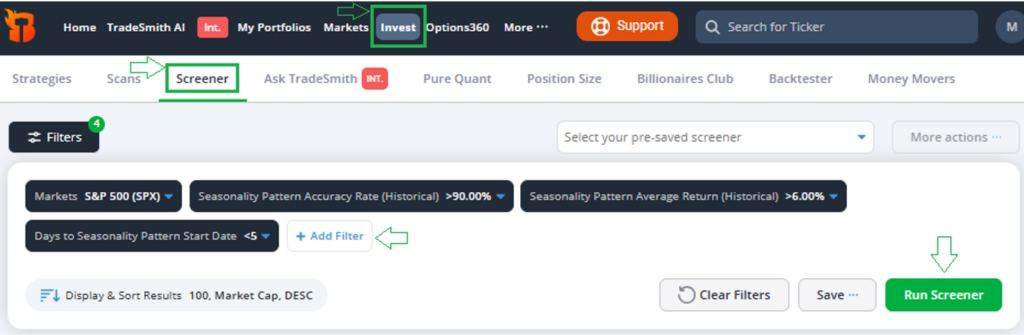
I simply click on Invest from the main menu bar, then click on Screener from the sub menu, which takes me to the page displayed above.
From here, I can set up my TradeSmith Screener with hundreds of different filters based on technical and fundamental data, plus our exclusive TradeSmith metrics, including Seasonality.
I just click on + Add Filter to insert these four filters:
- Markets: I added the S&P 500 Index
- Seasonality Pattern Accuracy Rate: I set it to more than 90%
- Seasonality Pattern Average Return: I select more than 6%
- Days to Seasonality Pattern Start Date: Set to less than 5 days.
With these filters, I can screen the S&P 500 Index for any stocks with bullish seasonality patterns that are now underway or start within the next 5 days.
Plus, I’m looking only for stocks with a near-perfect 90% accuracy rate, that have averaged gains of at least 6% or more during this seasonal window.
Once my filters are set, I click on “Run Screener” to find my results. When I ran it this week I got 54 results.
Let’s take a closer look at a few of them.
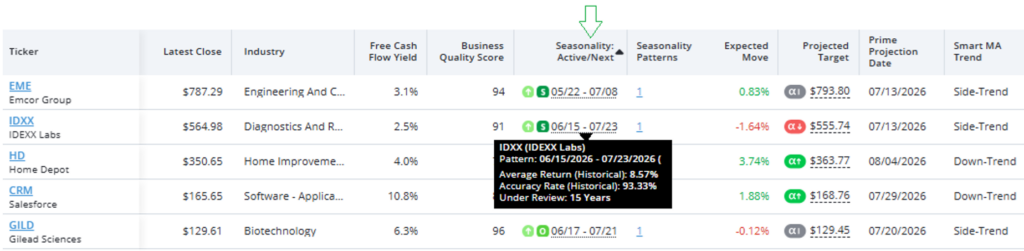
The column labeled Seasonality Active/Next displays the exact dates of the bullish seasonality pattern that’s currently active, or the next seasonality period coming up.
I can simply hover my mouse over the highlighted dates in this column for any stock in the results list to see detailed seasonality stats.
For example, Idexx Labs (IDXX) has an active bullish seasonal pattern that started June 15 and runs through July 23.
During this window, IDXX is up 93.33% of the time with an average return of 8.57% over the past 15 years!
Bottom line: Our Trade Cycles Seasonality tools combined with the TradeSmith Screener can help you find stocks in a seasonal sweet spot. These are stocks that have historically rallied at certain times of year. And July is a target-rich seasonal rally phase.
Good investing,

Mike Burnick
Contributing Editor, Market Minute
P.S. If you’re interested in exploring these types of tools, how they can help take the guesswork out of the markets and maximize your returns, go right here.