
Listen to the audio version of this article (generated by AI).
Managing Editor’s Note: Today, we’re hearing from our contributing editor Mike Burnick in his weekly feature.
Mike has over 30 years in the investment and financial services industry – from operating as a stockbroker, trader, and research analyst, to running a mutual fund as a registered investment advisor and portfolio manager, to being Research Director for the Sovereign Society, specializing in global ETF and options investing.
And he’s been senior analyst at TradeSmith for three years, running Constant Cash Flow, Infinite Income Loop, and Inside TradeSmith.
Here’s Mike…
The Clock May Have Run Out for a Market Breakout
BY MIKE BURNICK, CONTRIBUTING EDITOR, MARKET MINUTE
The S&P 500 has been coiling up in a sideways trading range recently, as Jeff pointed out last week.
But if the market is going to breakout, it’s running on borrowed time, according to our Trade Cycles seasonality tools.
Here’s a chart of the S&P 500 updated through last week’s close and you can clearly see the wedge-like pattern that’s developed in recent weeks.
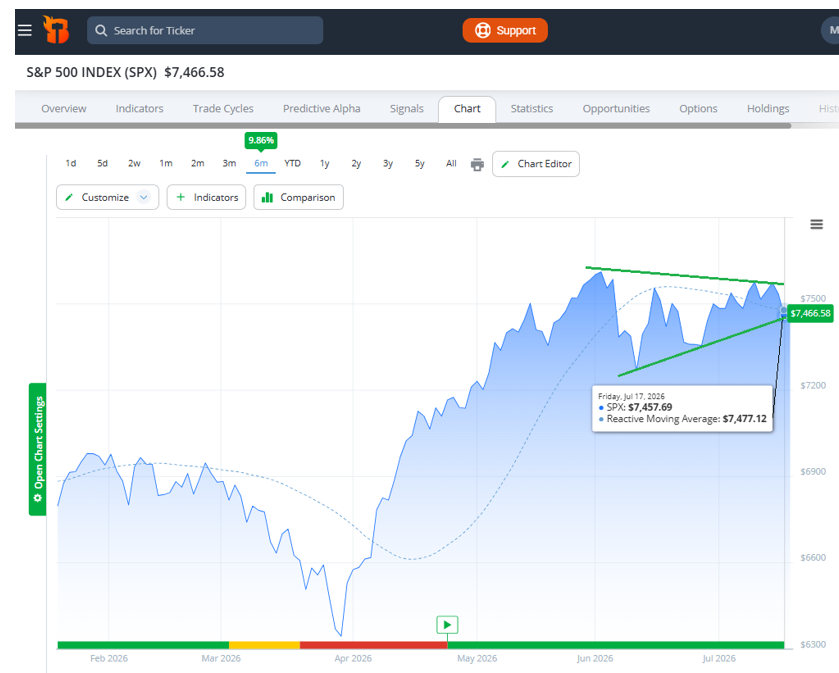
It’s a classic pattern of lower highs and higher lows. This typically means a big move is coming… one way or another.
Last week the S&P appeared to be breaking out above the red downtrend line. But last Friday it retreated back inside the coil.
It’s at a critical spot too, according to our technical indicators.
The Trade Smith Reactive Moving Average (dashed blue line) sits near 7,477 right now.
Years of historical data tells us the stock market – and individual stocks – typically perform better when prices are above this key moving average. So, to maintain upward momentum, the S&P 500 needs to hold above this important moving average.
And a closer look at our Trade Cycles indicators reveals more bad news: The S&P 500 has run out of “green days.”
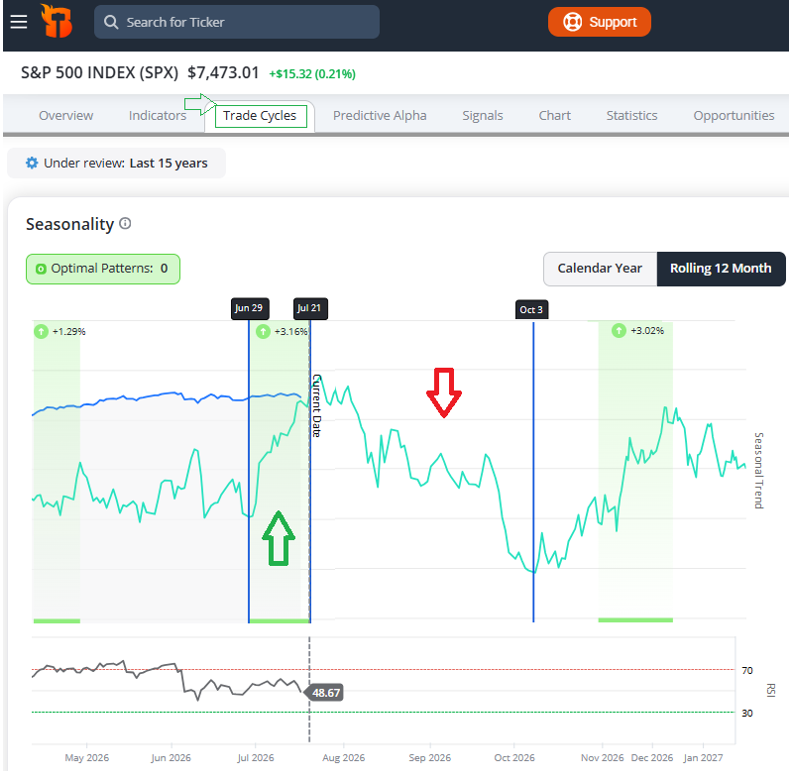
As you can see above, a bullish seasonal window just slammed shut for the S&P 500, according to our Trade Cycles analysis.
We call these bullish seasonal windows green days, and history shows it’s a great time to be invested in stocks. Over an 18-year backtest, bullish seasonal trades delivered 857% in total growth!
The S&P was in a bullish seasonal window for the past month. And sure enough, stocks moved up.
But this bullish window closed two days ago, on Tuesday, July 21. And the seasonal trend points down from now through early October.
Historically, the S&P 500 is only up about 50% of the time during this period, posting negative returns of -1.14% on average over the last 15 years.
Bottom line: The clock may have run out for an S&P 500 breakout, according to our seasonal analysis. This doesn’t mean stocks will collapse. But a rally now requires the market to make its move against a consistent seasonal headwind over the next few months. Market swings like this can be both a threat AND an opportunity, if you trade alongside consistent seasonal trends.
Good investing,

Mike Burnick
Contributing Editor, Market Minute