

Listen to the audio version of this article (generated by AI).
Managing Editor’s Note: Today, we’re hearing from our contributing editor Mike Burnick in his weekly feature.
Mike has over 30 years in the investment and financial services industry – from operating as a stockbroker, trader, and research analyst, to running a mutual fund as a registered investment advisor and portfolio manager, to being Research Director for the Sovereign Society, specializing in global ETF and options investing.
And he’s been senior analyst at TradeSmith for three years, running Constant Cash Flow, Infinite Income Loop, and Inside TradeSmith.
Here’s Mike…
Watch These Indicators to Spot an Upside Reversal for Nasdaq
BY MIKE BURNICK, CONTRIBUTING EDITOR, MARKET MINUTE
Last week I pointed out how the S&P 500 has been stuck in a narrow trading range. And that time is running out for an upside breakout, according to our Trade Cycles seasonality studies.
Today, let’s take a closer look at the other widely followed index, the Nasdaq 100 (NDX) because it’s showing evidence of stabilizing from the recent pullback, which could be bullish signal for the stock market.
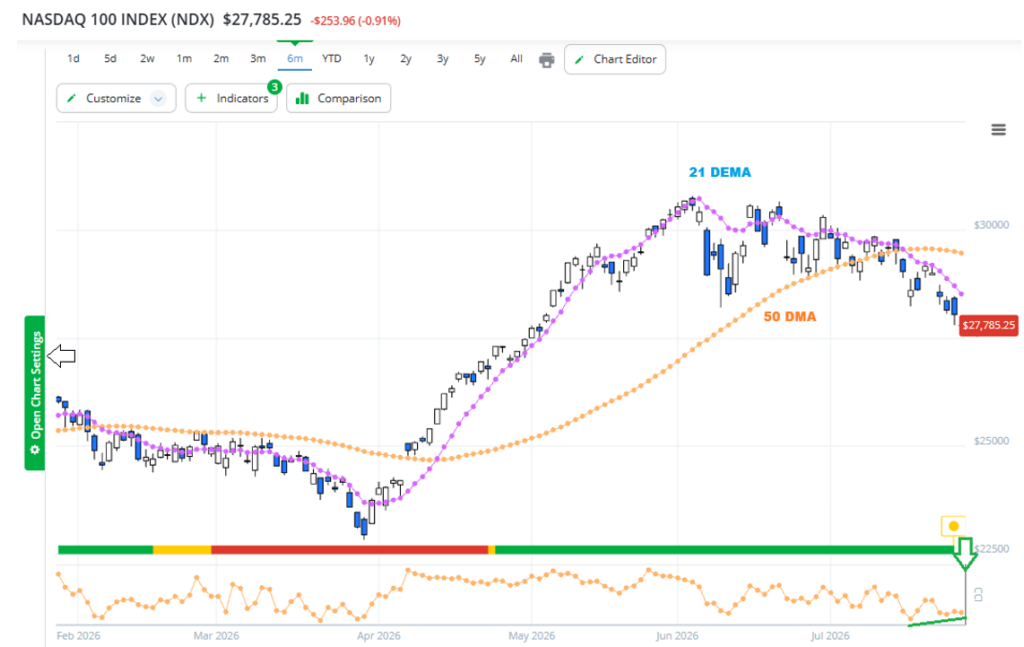
In the chart above you can see NDX compared to its 50-day moving average (orange line) and the 21-day exponential moving average (purple line). And at the bottom is one of my favorite technical indicators, the Commodity Channel Index (CCI).
TradeSmith subscribers can click the green Chart Settings button on the left on our charts to add dozens of technical indicators. This includes overlays, like the 50 DMA, and oscillators, like CCI. Plus, draw comparisons with other stocks or indexes.
Now, let’s see what all these indicators are telling us right now…
NDX broke below its 50 DMA in early July. The S&P 500 Index also slipped below the same key level last week.
When price is below this key moving average, it’s usually bad news for stocks.
Since 1990 in fact, investing in the S&P 500 only when price is above the 50 DMA would have made you 60% more money than simply buying and holding.
Now for the good news.
Notice how NDX has stayed consistently below the 21 DEMA during its decline. An exponential moving average like this can react much faster to price changes than the standard 50 DMA.
And that makes it a key trend line to watch closely for a potential upside price reversal.
Another piece of the puzzle is supplied by CCI. This momentum indicator is also very useful for spotting price reversals and new directional trends. Right now, it’s showing a positive divergence with price, which is bullish.
Notice that CCI stopped declining. Its last low was July 17, and even with NDX making new lows since then, the CCI hasn’t moved down.
That tells me price momentum is improving and a new uptrend may be near.
Bottom line: I’m watching for NDX to move back above its 21-day exponential moving average while the Commodity Channel Index makes higher highs. That might signal an upside reversal for Nasdaq that traders are waiting for, or at least a tradeable bounce for stocks.
Good investing,

Mike Burnick
Contributing Editor, Market Minute