
Listen to the audio version of this article (generated by AI).
Managing Editor’s Note: Today, we’re hearing from our contributing editor Mike Burnick in his weekly feature.
Mike has over 30 years in the investment and financial services industry – from operating as a stockbroker, trader, and research analyst, to running a mutual fund as a registered investment advisor and portfolio manager, to being Research Director for the Sovereign Society, specializing in global ETF and options investing.
And he’s been senior analyst at TradeSmith for three years, running Constant Cash Flow, Infinite Income Loop, and Inside TradeSmith.
Here’s Mike…
How to Hedge Downside Risk With a Favorable Reward/Risk Payoff
BY MIKE BURNICK, CONTRIBUTING EDITOR, MARKET MINUTE
Previously I pointed out that September-October seasonality is not kind to the stock market. And during mid-term election years, the potential downside is magnified.
But with the last week of September fast approaching, so far stocks have held up. That’s especially true considering sky-high oil prices and rising interest rates.
In fact, markets seem downright complacent at the moment, as our Trade360 Options Market Indicators clearly show.

Options360 subscribers can quickly view these key option market indicators by logging into TradeSmith Finance, clicking on Options360, then Dashboard.
Our Put/Call Ratio (PCR) Sentiment indicator (below left) reflects this broad complacency.
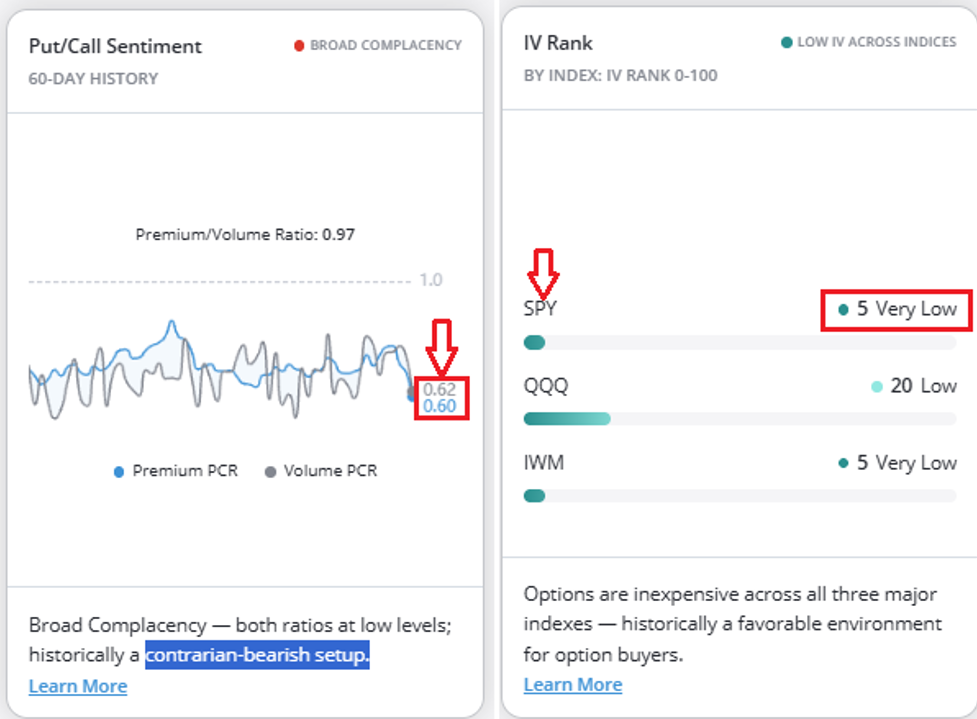
Both the option Premium PCR and the option Volume PCR are at unusually low levels.
This is often a contrarian-bearish setup pointing to a potential market drop.
And at the same time, the Implied Volatility Rank (above right) for the S&P 500 ETF (SPY) is at very low levels.
This means options are cheap right now at the same time that complacency reigns supreme.
And that’s a setup for a rude wake-up call for markets.
One way to take advantage of this setup is buying cheap SPY put options to hedge against any market move to the downside into October.
Options360 members can easily put this trade idea into practice by using our Calculator to run a Scenario evaluation on SPY put options.
Simply click on Calculator, then on Scenario. Then enter the ticker symbol for your underlying security and the option type (call or put), in this case SPY puts.
Next, make a few simple choices for your option expiration date and strike price.
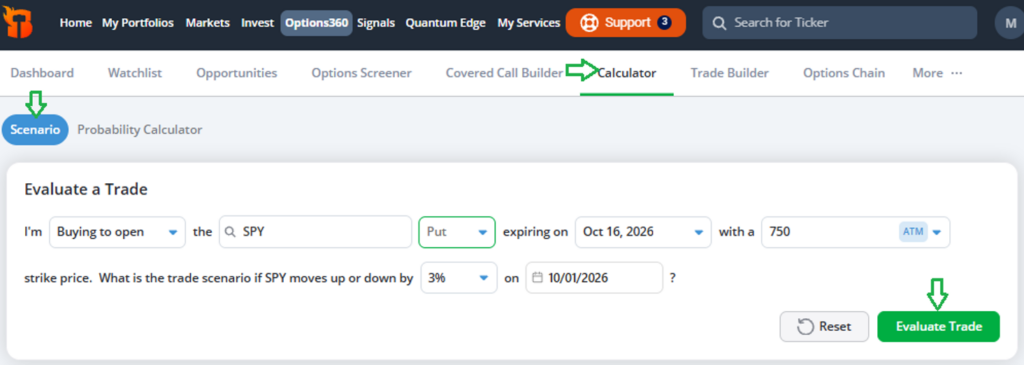
For instance, let’s choose an SPY put expiring Oct 16 with a $750 strike price.
You can modify any of these scenario parameters as you see fit, by choosing a different expiration date, option strike price, or change the expected percentage move and end date.
Once you’ve selected all your scenario parameters, just click Evaluate Trade.
In this trade scenario let’s see what happens if SPY moves up or down by 3% between now and October 1.
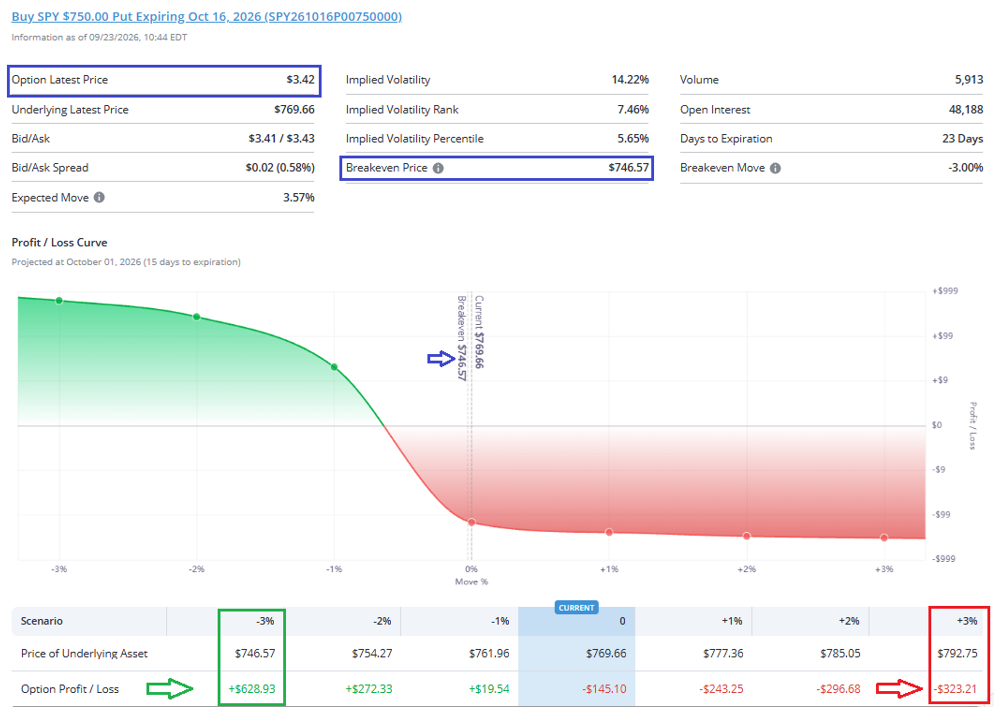
As shown, your breakeven price on this trade would be $746.57, not far below the strike price.
At breakeven you’ve covered the $342 cost of the put option and if SPY moves below this level, you’re earning profits on the trade.
The Profit/Loss Curve shows the possible scenarios for a +/- 3% move in SPY.
If SPY moves up 3%, your loss on the option trade is -$323.21.
But if SPY moves down 3% into October, your profit is +$628.93.
So, your potential profit is nearly 2x your possible loss. That’s the kind of asymmetric profit/loss potential I look for in a hedge trade.
Bottom line: The stock market is vulnerable to a seasonal slump, option market indicators show complacency (a bearish setup) and put options are cheap. That’s a good setup to consider hedging your downside risk with favorable reward/risk payoff potential.
Good investing,

Mike Burnick
Contributing Editor, Market Minute