
Listen to the audio version of this article (generated by AI).
Managing Editor’s Note: Today, a special message from our CEO, Keith Kaplan.
As investors, we’re bombarded with apocalyptic forecasts, video clips, X posts, biased news, propaganda, and useless information. And it’s easy to do the wrong thing when you’re being spun around by it all.
But there’s a way to tune out everything you hear in the media – all the bias… all the conflicting opinions… and focus only on the forces that move stocks. It’s an AI-powered software we developed at TradeSmith that takes a completely different approach.
It looks for certain “tells” in a stock’s trading data to spot when big moves are coming.
Keith recorded a video message about this breakthrough… plus he’ll tell you how you can access a trial version of this software, free of charge.
Watch Keith’s video and unlock your free trial.
Then read on for more from Keith on why the headlines always arrive after markets move… and how to stay ahead as an investor without them.
Every Stock Has a Tell – Here’s How to Read It
BY KEITH KAPLAN, CEO, TRADESMITH
Bill Belichick knows things about opposing quarterbacks that they don’t even know themselves.
Belichick coached the New England Patriots for more than two decades and won six Super Bowls. But it wasn’t just the wins that made him a legend – it was also the preparation behind them.
Every week, before facing a new team, he built a behavioral profile of its key players. Not just the obvious tendencies – like where a quarterback liked to throw on third and long or how he handles pressure – but also the really granular stuff.
How he responds to cold weather. Whether he holds the ball longer on turf than on grass. How a particular official’s calls shape his decisions.
FBI profilers built an entire discipline around the same idea. Study anyone carefully enough, and their behavioral patterns become visible – and predictable. Not perfectly… but enough to act on.
Most investors don’t realize it. But every stock has its own behavioral profile, too – its own habits, quirks, and tells.
Once you learn how to read that profile, the market looks less like a random system and more like a place where patterns govern what happens next.
At TradeSmith, my team and I have spent more than a year developing a new type of pattern-extracting trading tool. It builds a behavioral profile of more than 2,000 stocks – and scans them every day for the specific patterns that have historically preceded big moves.
I’ll show you how it works in a moment, and how it’s found recurring patterns with historical accuracy rates of 90% and higher.
I’ll also give you a chance to test drive our software ahead of our upcoming launch event.
First, it’s important you understand that we haven’t just created revolutionary new software. This is a whole new way to think about markets… and a whole new way to make money.
Each Stock Has Its Own Story
We all know there are different ways to analyze stocks and select trades. The main two are fundamental analysis and technical analysis (also known as chart analysis).
With fundamental analysis, you look at what a company is worth and whether the market is pricing it correctly. Warren Buffett made this method famous. It works. But it applies the same framework to every company, as if they all behave the same way.
With technical analysis, you look at how a stock is trading rather than what the business is doing. It also works. But like fundamental analysis, it also applies the same frameworks to thousands of different companies.
Then there’s a game-changing third approach that we’ve been working on at TradeSmith.
Where fundamental analysis asks what a company is worth, and technical analysis asks how it’s been trading, our approach asks something different entirely.
How does this specific stock behave – and when does that behavior signal a big move?
We call it Behavioral Profile Analysis (BPA). And it changes how you think about trading.
This Changes How You See Stocks
At the foundation of BPA is the simple observation: Every business in the world is unique.
This means every stock has its own way of behaving and its own way of reacting to what happens in the economy and the markets.
For example, an IT company like Oracle (ORCL) will behave differently than an oil producer like Chevron (CVX). And a big drug company like Pfizer (PFE) will behave differently than a retailer like Macy’s (M). Again, two very different business models.
When you look at the markets this way, stocks start to resemble people. Each one has its own behavioral patterns – its own habits, tendencies, and quirks.
The same economic event hits two companies differently. The same market development triggers two different reactions. And underneath it all, each stock leaves behind a distinct trading “thumbprint.”
But most of those thumbprints are invisible to the human eye.
That’s why the system we developed evaluates 10.4 million potential trades every day across 2,467 stocks. It runs each one through hundreds of calculations, looking for the specific combinations of factors that have historically preceded big moves.
We tested this strategy from every angle. Here’s what we found.
When These Factors Align, Gains Tend to Follow
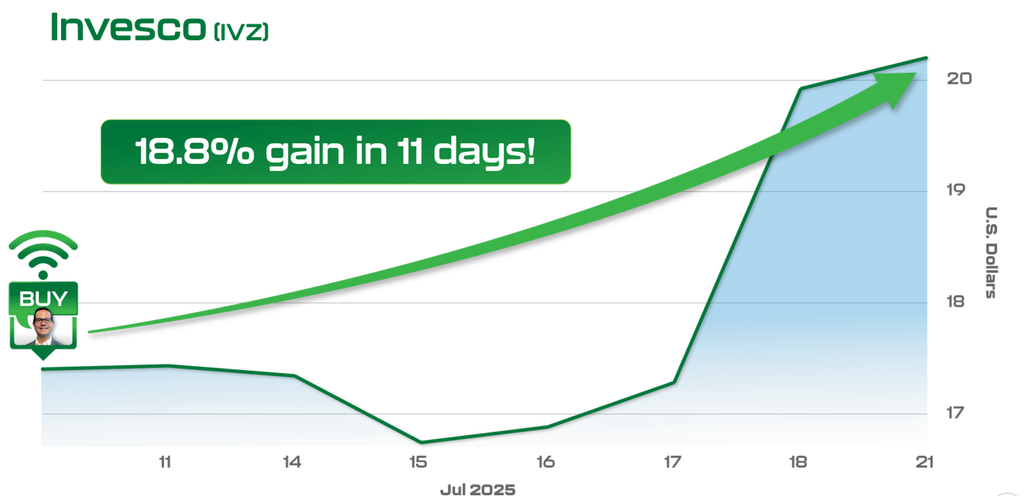
Invesco (IVZ) is one of the world’s largest investment management firms.
We ran it through our system and found that two factors had to align for IVZ’s signal to fire. The stock’s Bollinger Percent B and its Money Flow Index both had to exceed 80.
Bollinger Percent B measures where a stock’s price sits relative to its recent trading range. The Money Flow Index tracks whether money is flowing into or out of the stock.
No human analyst would’ve cracked this specific pattern because nobody would ever think to look for it.
But this signal produced an 18.8% gain in 11 days.
For Lam Research (LRCX), one of the largest makers of semiconductor manufacturing equipment, the pattern was different.
Two different factors had to align for this signal to fire. The stock had to close above its 200-day moving average. And that close had to fall exactly two trading days before a market holiday.
Nothing about the company’s earnings… about the semiconductor sector… or about the broader market. Just a price condition and a calendar condition, lining up at a specific moment.
That’s it.
When the signal fired on August 28, 2025 – two trading days before Labor Day – LRCX gained 11.4% in 15 days.
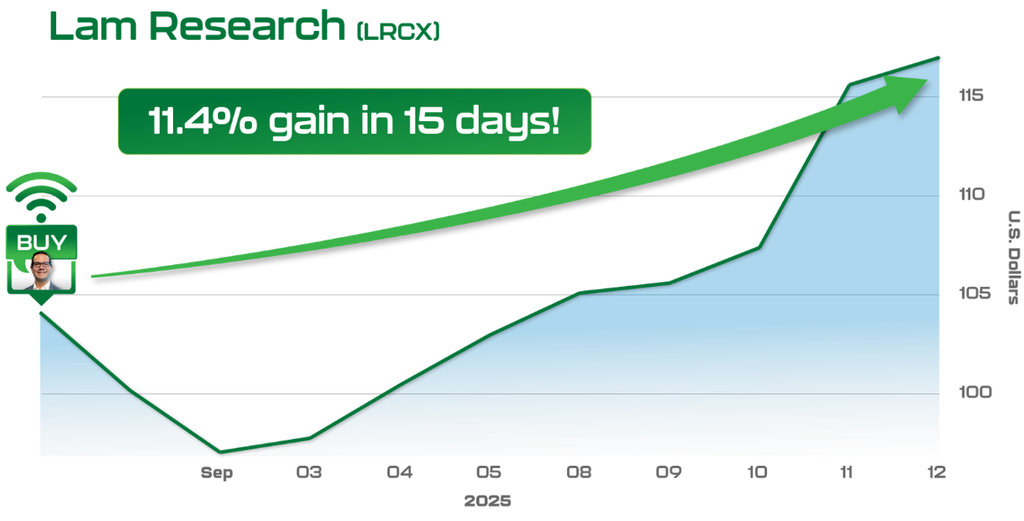
The historical accuracy rate behind that signal was 86%.
And we didn’t stop there.
In January and February, we also ran a live beta test using these same signals internally. And the results were just as powerful.
These Live Test Results Blew Us Away
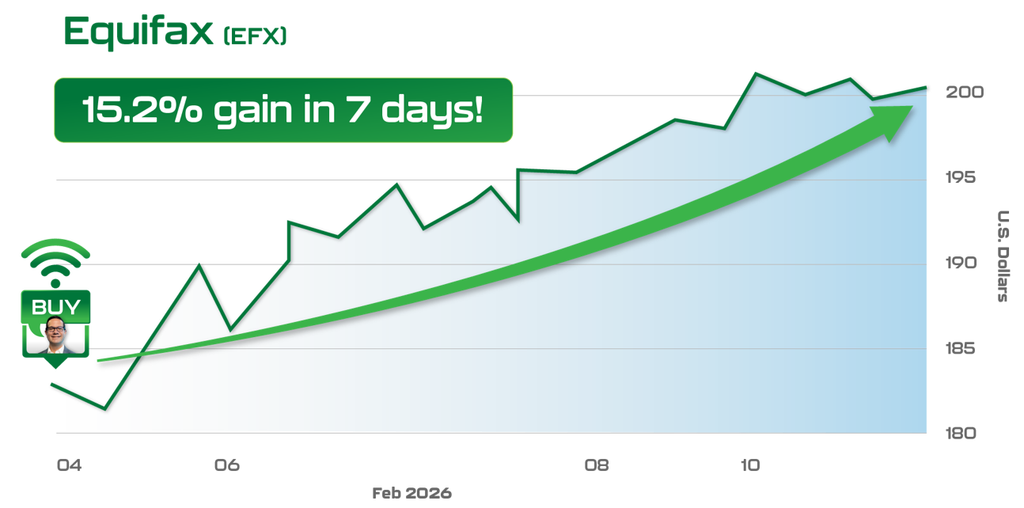
One of our beta test trades was on Equifax (EFX). It’s one of America’s largest consumer credit reporting agencies.
Again, two factors had to align for this signal to fire. The stock had to close down four consecutive days. And market volatility had to rise above its 10-day average.
When both conditions aligned, the result was a 15.2% gain in seven days – against a 91% historical accuracy rate.
With these examples, we were trading our signals with stocks.
When we applied our signals to options trades, the results included:
- Caterpillar (CAT): 126% in 72 hours
- Nvidia (NVDA): 129% in 5 days
- Lockheed Martin (LMT): 365% in 30 days
- HCA Healthcare (HCA): 461% in 13 days
- Generac (GNRC): 1,082% in 33 days
We’ve invested more than a year’s work… and millions of dollars… into this system. But as you can see, the results are worth it. We’ve created the most advanced analytical platform in our firm’s 21-year history.
And because it looks at the world in a way that more than 99% of investors never think of, it gives you a powerful edge.
It’s thinking differently… trading differently… and delivering market-beating trades as a result.
I’ll walk you through the technology behind it – and the trades it’s flagging for the weeks ahead.
In the meantime, take it for a test drive. By registering for the event here, you’ll get immediate access to our software ahead of the launch.
I hope to see you there.
Keith Kaplan
CEO, TradeSmith
P.S. Not every signal lasts forever. When enough traders discover an anomaly, they trade it to death. The edge closes.
Renaissance Technologies – the world’s most successful hedge fund – understood this better than anyone. Every day, its systems measure “signal decay.” The second a signal stops working, it’s killed without mercy.
Our system does the same thing. But right now, the window is still open for many of our best signals. I’ll show you what that means for you at the event on November 18.