
Managing Editor’s Note: Today, we’re hearing from our contributing editor, Mike Burnick, in his weekly Thursday feature.
Mike brings 30 plus years of hands-on market experience — from trading floors and research desks to running his own mutual fund as a registered investment advisor — and now leads multiple TradeSmith advisories including Constant Cash Flow, Infinite Income Loop, and Inside TradeSmith.
And he zeroes in on the beaten-down healthcare sector, explaining why its prolonged weakness may have quietly set up one of the more compelling low-risk, high-reward trade opportunities in the market right now.
Now, here’s Mike…
Extreme Fear & Greed Indicates Market Rebound Potential
BY MIKE BURNICK, CONTRIBUTING EDITOR, MARKET MINUTE
Market volatility continues as mixed signals about the end game in the war with Iran keep making headlines.
Welcome to investing in the age of chaos!
Our TradeSmith Fear & Greed Indicator shows you just how oversold stocks are right now.
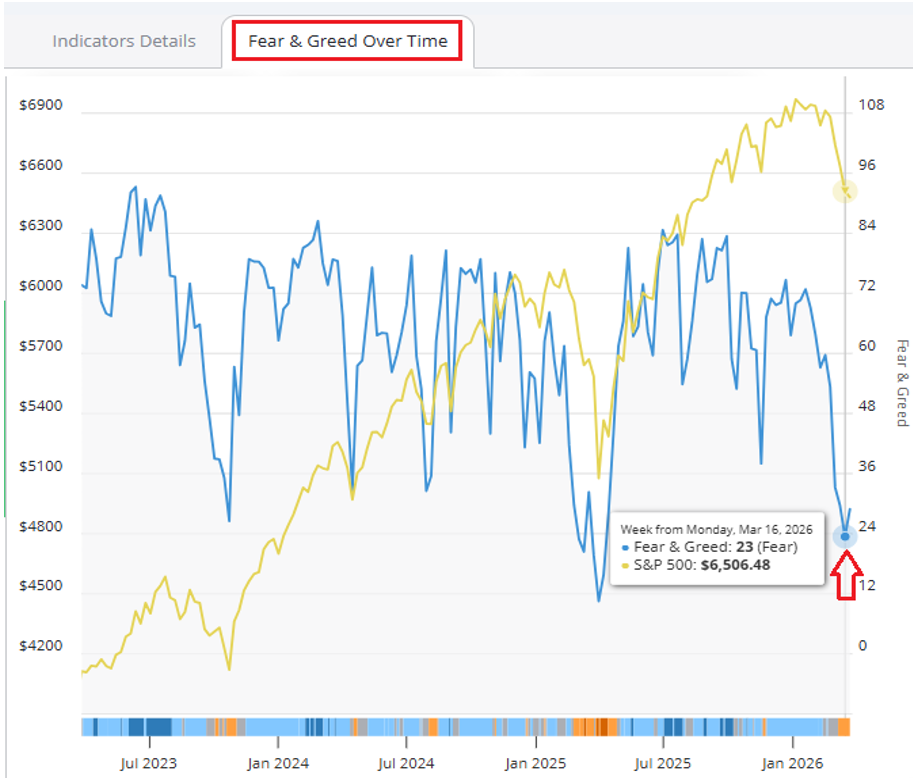
As of Monday, March 16, Fear & Greed hit a low of 23 (Fear), which is just 3 points away from the “Extreme Fear” level that has consistently signaled market lows in the past.
That’s close enough for me.
Additionally, take a closer look at the details behind the Fear & Greed indicator and you’ll find some of the most reliable individual indicators may have already bottomed out and turned up again.
In fact, out of the 7 Fear & Greed component indicators, 4 are reading Extreme Fear right now and another reads Fear.
To view the Fear & Greed component indicators on TradeSmith Finance, simply click on the Market Outlook page (under Markets) then on Fear & Greed Detailed Overview.
Finally, click on the Fear & Greed Over Time tab. Using the red Chart Settings tab at left you can select some or all of the individual component indicators to plot on the chart, plus market price overlays for the major stock indexes.
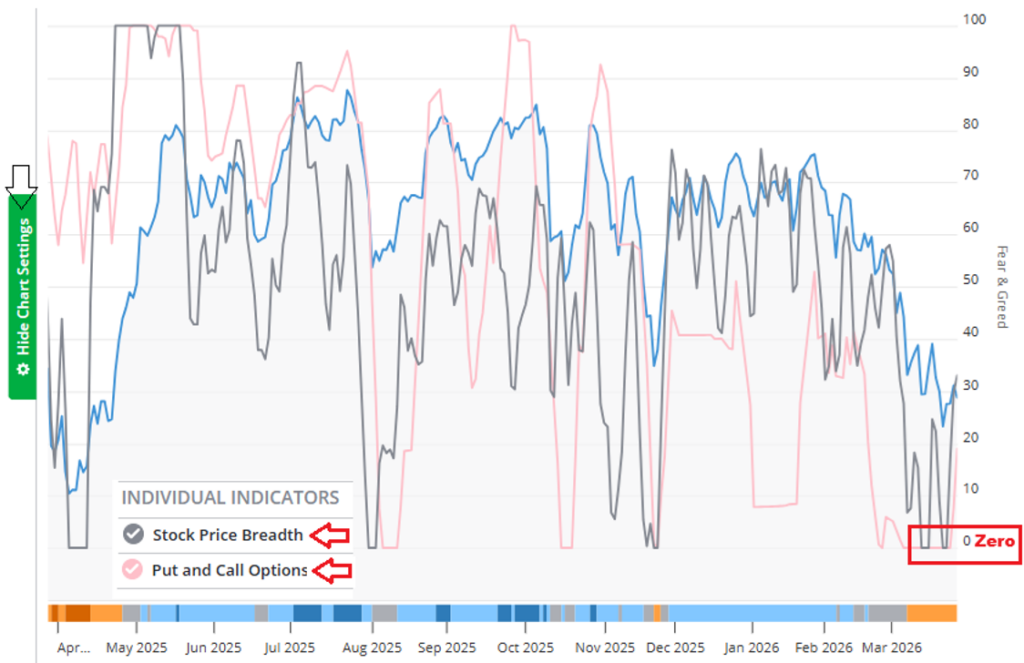
In the chart above, I selected two of my favorite Fear & Greed components: Stock Price Breadth and Put and Call Options activity, along with an overlay of the S&P 500 Index.
You can see at a glance that Breadth and Put/Call Options – which are both reliable sentiment indicators – hit zero twice in the past two weeks, then rebounded.
- Market Breadth measures the difference in advancing vs. declining volume in stocks listed on the NYSE. And when it reaches an extreme low (zero) it has reliably signaled market bottoms in the past.
- Put and Call Options compares the volume of bearish puts vs. bullish calls. When the ratio gets lopsided like this (zero) it means more puts traded, which signals extreme fear typical of a market low.
Bottom line: We’ve seen extremely oversold readings in stocks, and some positive divergences in market breadth and sentiment indicators are now appearing. This tells me to expect a rebound rally at some point soon. Now is the time to add new stocks to your watch list for a buy-the-dip opportunity.
Good investing,

Mike Burnick
Contributing Editor, Market Minute