
Listen to the audio version of this article (generated by AI).
Managing Editor’s note: In 2008, Andy Swan paid $250 for a bottle of bourbon. That same bottle, which he recently uncorked, currently sells for $5,000. Below, Andy, cofounder of LikeFolio, the firm behind our MegaTrends research, explains what that price jump taught him about spotting big stock moves before Wall Street does.
Today at 1 p.m. ET, Andy, his brother, Landon, and our corporate partner Marc Chaikin, founder of Chaikin Analytics, are hosting The Stock Tsunami Event. They’ll share the stocks their two systems are flagging right now, plus three free stock ideas for attendees: two to buy and one to sell. Go here to reserve your spot immediately.
How a Bottle of Bourbon Changed How We Pick Stocks
By Andy Swan, Senior Analyst, TradeSmith
In 2008, in Louisville, Kentucky, I paid $250 for a dusty bottle of Pappy Van Winkle 23-year-old bourbon.
I still have that bottle, signed by Julian Van Winkle III, the grandson of “Pappy” himself, after I cold-called him.
I didn’t open it until recently, onstage, at an investor conference in Las Vegas. (More on that below.) Because I had a pretty good idea its value was going to go up.
You see, the folks who loved Pappy were already talking about it online, in the forums and threads where fans go to chat.
That chatter was building in 2008. The price of Pappy Van Winkle bourbon in the collector’s market wasn’t.
For years, the online chatter got louder and more enthusiastic while the price of that rare bourbon sat flat. Then the price jumped. By 2013, a bottle of Pappy 23 sold for $1,750 on the secondary market. By 2022, it hit $5,000 – a 1,900% gain.
The bottle didn’t change, and neither did the bourbon inside it. What changed was how many people wanted it, and you could see that desire long before you could see it in the price.
It’s all in the chart below. The gold line shows how much people were talking about Pappy 23. The gray line shows what a bottle sold for. The gold line starts climbing first.
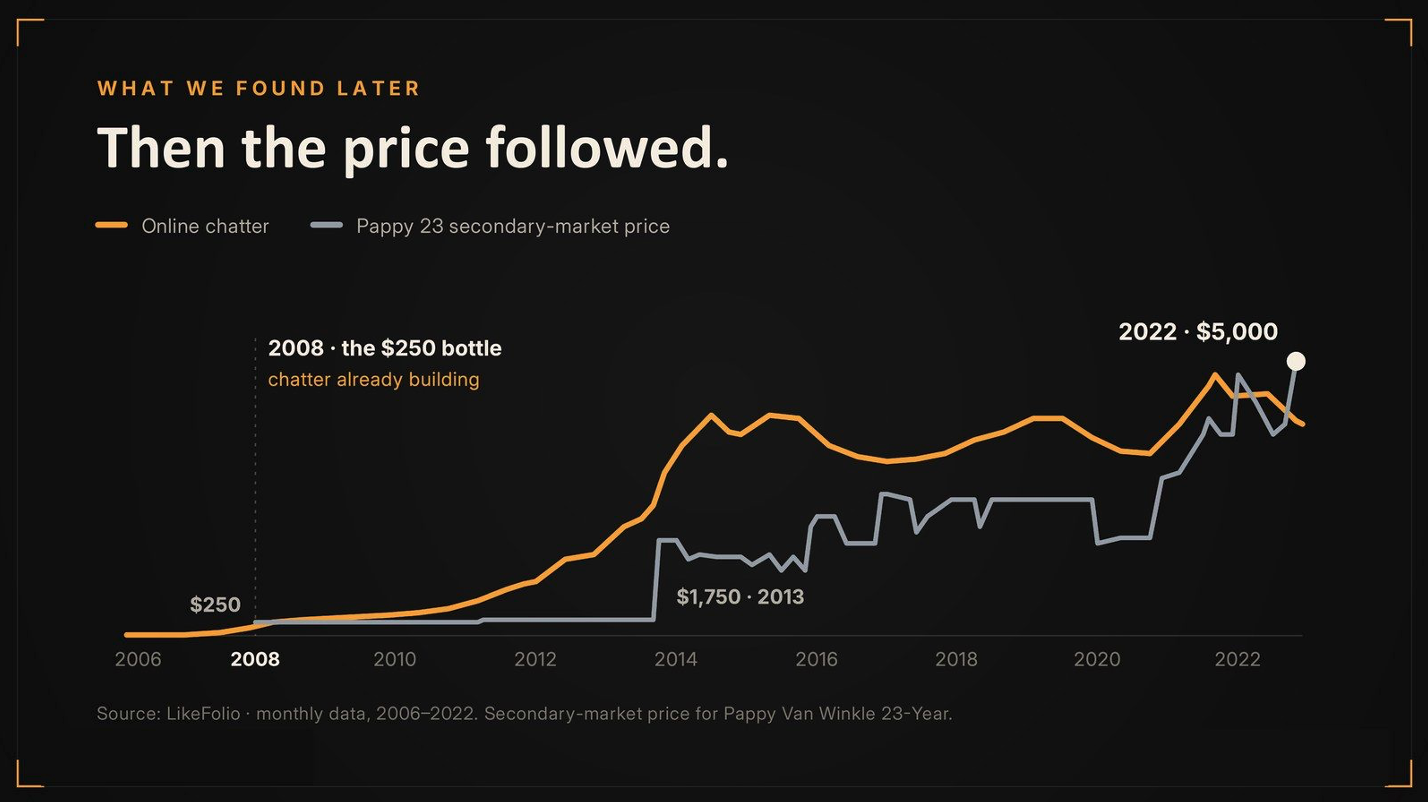
The price line sits flat for years. Then jumps from $250 to $1,750 to $5,000… after the chatter has been building.
As we’ll get into today, the same thing happens with stocks. Consumer demand moves first, and prices follow.
People buy the product, download the app, search for the brand, and talk about it to anyone who’ll listen. Months later, it shows up in an earnings report. And it’s only then that Wall Street starts to pay attention.
That gap between when shoppers start buying and when Wall Street notices is where some of the biggest gains in the market are made.
And thanks to a new partnership with Wall Street legend Marc Chaikin, we can now spot it earlier than ever. In our testing, when our data and Marc’s system agreed on a stock, it went on to double or more at its peak 6 out of 10 times. The best of those stocks soared as high as 8,076%.
Finding Signals in the Online Noise
Consumer demand shows up online long before it shows up in a company’s earnings report… or its share price. That simple idea became the foundation of the investment software tools my brother Landon and I have built.
Spotting trends early has always been our edge. Long before most investors had heard of livestreaming, we were one of the first financial firms to broadcast trading-day videos over the internet. We also built one of the first social networks for investors.
So when social media took off, we saw a chance to listen in on what shoppers were saying. In 2012, we started tracking what millions of Americans post online about the brands and products they buy.
Today, with the help of AI, we track posts on X, Reddit, and YouTube… along with search trends, app downloads, podcasts, and forums. Then we map this consumer sentiment data onto thousands of publicly traded stocks.
Say someone posts on X that Celsius tastes better than Monster and is a lot healthier. Our system counts that as good news for energy drink maker Celsius (CELH). It also counts it as bad news for its rival Monster Beverage (MNST), because the post compares the two directly.
The hard part is knowing which of those signals matter most. Not every online mention carries the same weight, and not every consumer sentiment trend predicts corporate revenues.
AI helps us separate the noise from the true signal. It picks out the consumer behaviors that have historically led to big stock moves… and spots those patterns much earlier than traditional research can.
For example, in late 2024, searches for nuclear and data-center power exploded. People had figured out that AI needs power. And they wanted to know who could provide it.
Our data showed online sentiment running hot around a small nuclear reactor company named Oklo (OKLO). It makes the kind of reactors you can co-locate with an AI data center – making it a perfect fit.
We told our subscribers to buy. Following that recommendation, Oklo rose as much as 600%.
The same data put our readers into DraftKings (DKNG) before a 218% gain… Zoom (ZM) before it went up 192%… and Coinbase (COIN) before it rose 445%. In all, we’ve closed 28 trades that doubled or better in the past five years.
It was the same pattern we saw with the bottle of bourbon. The talk came first. The price followed.
What a Wall Street Legend Learned After 60 Years
Wall Street legend Marc Chaikin heard Landon and me describe this idea at a recent investor conference.
Marc has spent 60 years working with and building tools that catch what he calls the “money wave” – the moment Wall Street notices a trend and the big buyers pile in.
That’s what his Power Gauge system does…
It looks at more than 20 factors behind a stock, from its finances and earnings to what insiders and short sellers are doing with their money. Then it boils it all down to one rating. When the overall picture on a company looks good, the Power Gauge turns green. When the picture is weak, it turns red.
Marc will also tell you that every money wave starts with a demand wave. That’s when millions of people fall in love with a product, buy it, and talk about it online.
For most of his career, he could measure the money wave – but not the demand wave that preceded it.
That’s where our consumer sentiment analysis comes in.
Think of Marc’s Power Gauge as the buoy near the shore. It reads how big a wave is as it gets close. And its red, yellow, and green ratings tell you whether it’s a good time to get on it.
Our data is the sensor on the ocean floor. It picks up the first movement, when people start buying. It happens long before any of that shows up in a company’s numbers.
Marc wanted to know what would happen if you combined his system with ours.
Would it allow him to pick up on the money wave ahead of time the same way a seismometer could pick up an undersea quake before it became a tsunami?
The answer was a resounding “yes.”
As I mentioned, when our two systems lined up, the stock went on to double or more 6 out of 10 times. Here’s what that looked like in practice.
With AI chipmaker Nvidia (NVDA), our system spotted the wave just 12 days before Marc’s Power Gauge turned “very bullish.” But those 12 days could have added more than 500 percentage points to your gain.
With SoundHound AI (SOUN), the company behind the software that takes phone orders at Chipotle and Krispy Kreme, our system would have flagged it two years earlier. That could’ve turned a 139% gain into a 756% gain.
Why We Pulled the Cork
Onstage at an investor conference in Las Vegas recently, Landon and I held up another bottle of Pappy 23. I told the room it was worth about $5,000, unopened.
Then Landon pulled the cork.
A few people in the front row actually winced.
Most of the people in the room hadn’t tasted it. But they had a sense of what it was worth because of what they’d read, heard, and scrolled past about it for years online.
The talk came first. The price followed. It always does.
That’s what our data measures, every day, across thousands of stocks. And right now, it’s showing something I don’t want you to miss.
Today at 1 pm ET, Marc, Landon, and I will show you what both our systems are flagging today… why you’ll want to have this research before Nov. 3… and three free stock ideas as a thank you for coming: two to buy and one to sell.
Reserve your spot immediately right here.
Until next time,
Andy Swan
Senior Analyst, TradeSmith