
If you want to know the stock market’s next move, just look at the past.
Maybe that sounds crazy, or at least illogical. After all, don’t the typical financial disclosures always remind us “past performance is not indicative of future results?”
But, when it comes to the short-term direction of stock prices, the past performance is an outstanding indicator of what to expect in the future. If you can go back in time to when investors’ emotions were similar to how they are today, then you can use that previous performance as a road map for where stocks are headed in the days/weeks to come.
Back in January, I questioned, “Has the Market Peaked?” The S&P 500 was trading at 6965. Investors were enthusiastically bullish.
And, many of the technical indicators we follow were setting up similarly to how they were in early 2025 just before the “tariff tantrum” roiled the stock market. It sure looked like we were setting up to follow the same script in 2026.
Now, as we approach the anniversary of the Liberation Day decline, the similarities in the market conditions are just stunning. So, let’s use them to figure out where the stock market goes from here.
Here’s the updated chart of the S&P 500…
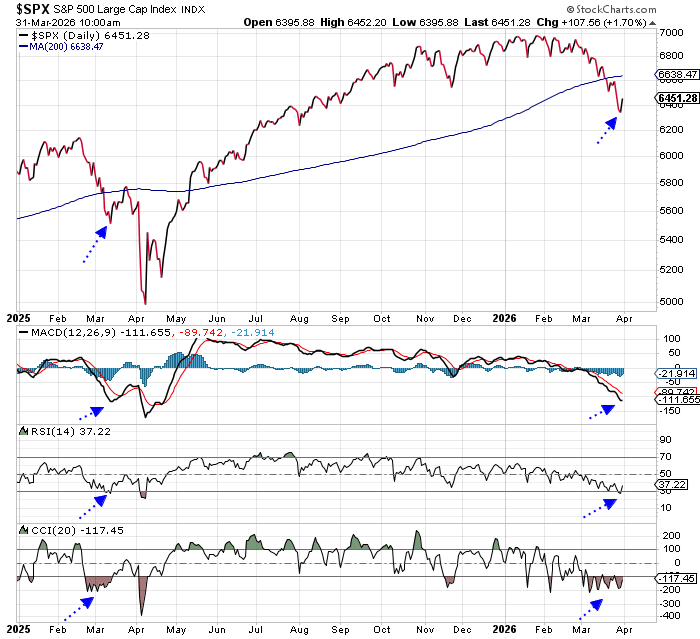
The squiggly blue line on the chart is the 200-day moving average (MA). This is a long-term moving average that many technical analysts use to assess the overall health of the stock market. If the S&P 500 is trading above the line, that’s bullish. If the index is below the line, that’s bearish.
In March 2025, the S&P 500 fell about 220 points below its 200-day MA before it managed to bounce. At that time, all the momentum indicators at the bottom of the chart were in extremely oversold condition.
Today, the setup is identical. On Monday, the S&P 500 closed about 220 points below its 200-day MA. And, all the momentum indicators looked similar to how they looked just prior to the mid-March bounce last year.
So, if we’re following the same script, then we should be looking for an oversold bounce to unfold the same way it did last year. In other words, the S&P 500 should be able to rally from here and challenge the resistance of its 200-day MA near 6640. That would be roughly a 300 point bounce off of Monday’s closing price.
Given that projection, and given the new VIX buy signal we wrote about yesterday, the bulls have an edge for the next few sessions.
The problem is what comes after the bounce has run its course. Last year, the S&P 500 rallied back to its 200-day MA. All the momentum indicators climbed into neutral territory. And, investors got enthusiastic again – thinking the worst was over.
It wasn’t.
The Liberation Day decline wiped out all the gains from the bounce, and pressed the market to a lower low before all the selling was exhausted.
Once again… If we’re following the same script as last year, then traders should have a few days to enjoy an oversold bounce from here.
But don’t get complacent. Be willing to trim long positions as the S&P climbs back up towards its 200-day MA.
We still may not have seen the worst of the decline just yet.
Best regards and good trading,

Jeff Clark
Editor, Market Minute
Free Trading Resources
Have you checked out Jeff’s free trading resources on his website? It contains a selection of special reports, training videos, and a full trading glossary to help kickstart your trading career – at zero cost to you. Just go here to check it out.