
Listen to the audio version of this article (generated by AI).
Managing Editor’s Note: Today, we’re hearing from our contributing editor Mike Burnick in his weekly feature.
Mike has over 30 years in the investment and financial services industry – from operating as a stockbroker, trader, and research analyst, to running a mutual fund as a registered investment advisor and portfolio manager, to being Research Director for the Sovereign Society, specializing in global ETF and options investing.
And he’s been senior analyst at TradeSmith for three years, running Constant Cash Flow, Infinite Income Loop, and Inside TradeSmith.
Here’s Mike…
Seasonality Is Turning Bearish for Oil
BY MIKE BURNICK, CONTRIBUTING EDITOR, MARKET MINUTE
Energy has been in the headlines a lot lately.
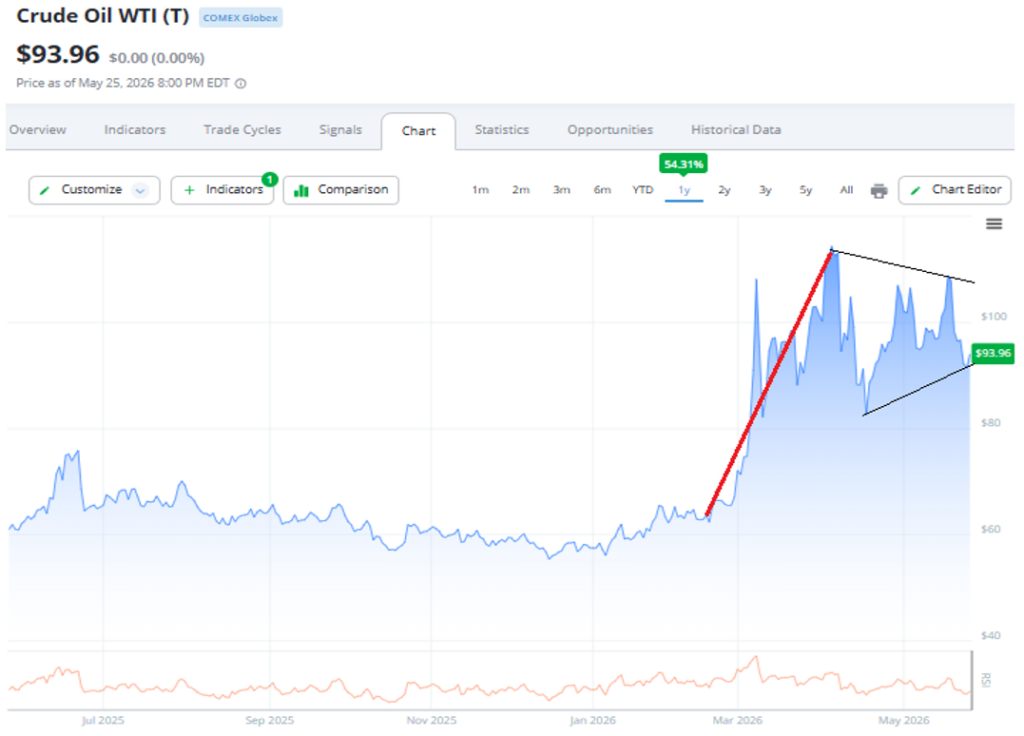
The conflict with Iran sent oil prices spiking, and that fed straight into inflation. The Producer Price Index – the government’s gauge of wholesale prices – climbed at a 6% annual pace last month.
Then last week, oil prices began to fall as rumors spread (again) that the fighting could end soon.
And energy stocks have also been on a rollercoaster.
The SPDR S&P Oil & Gas ETF (XOP) surged almost 40% in the wake of the Iran war. But now XOP like oil itself has pulled back almost 15% from its highs.
Is this the end of the bull run for oil and energy stocks? Or is it a buy-the-dip opportunity?
Our Trade Cycles Seasonality indicators give me a clear answer.
Stocks Have Their Seasons, Too
Stocks and sectors tend to follow recurring calendar patterns.
There are certain stretches of the year when a stock or ETF tends to rise – and other stretches when it tends to fall.
They’re not always easy to spot with the naked eye. But our Seasonality software tool has found patterns repeat year after year, going back decades.
You enter a ticker, and it shows you the exact windows when that stock has historically risen or fallen over different time periods
And seasonality is about to turn negative for energy stocks, as you can see below.
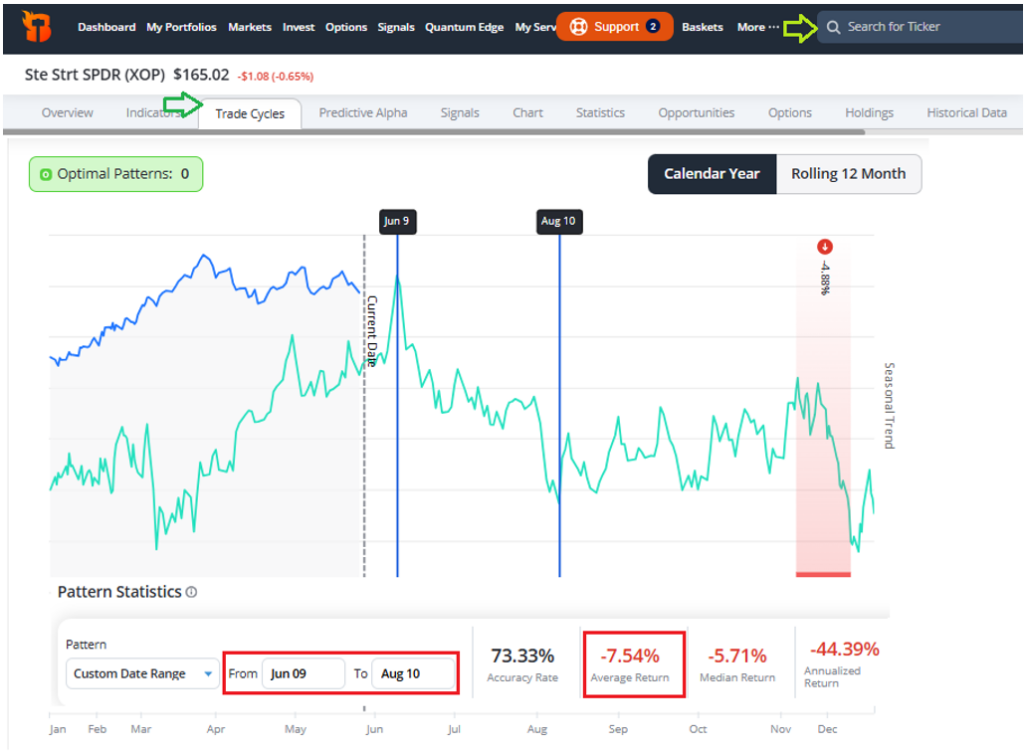
The blue line above is the current price trend for XOP and the green line is the typical Seasonal Trend.
Trade Cycles show a possible peak in XOP on June 9, with a Seasonal downtrend pattern likely through August 10.
During this seasonal period over the past 15 years, XOP has a negative average return of -7.5%.
Scroll down the Trade Cycles page a bit further and you’ll find the Pattern Returns chart on a year-by-year basis.
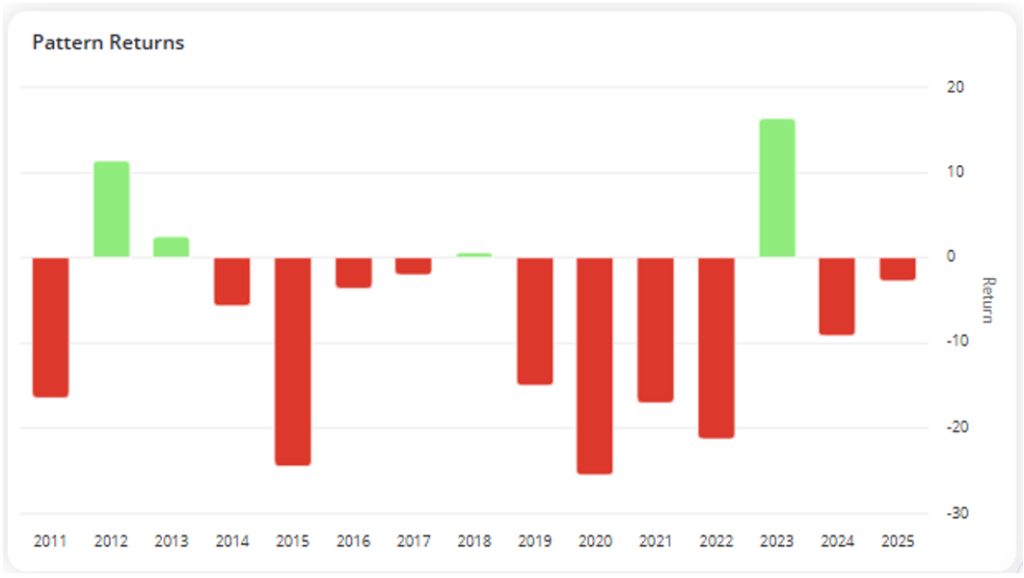
You can see at a glance this seasonal pattern has been consistently negative over the years.
XOP posted 10%+ gains only two times in the last 15 years. And it was down 10% or worse seven times.
Bottom line: Oil and gas stocks enjoyed a big boost due to the Iran conflict. Those gains are now fading. And our Trade Cycles Seasonality indicators tell us to expect more downside for this sector in the months ahead.
Good investing,

Mike Burnick
Contributing Editor, Market Minute