
Managing Editor’s Note: Today, we’re hearing from our contributing editor Mike Burnick in his weekly Thursday feature.
Mike has over 30 years in the investment and financial services industry – from operating as a stockbroker, trader, and research analyst, to running a mutual fund as a registered investment advisor and portfolio manager, to being Research Director for the Sovereign Society, specializing in global ETF and options investing.
And he’s been a senior analyst at TradeSmith for three years, running Constant Cash Flow, Infinite Income Loop, and Inside TradeSmith.
Here’s Mike…
Stock Market Breadth Is Stalling at This Key Moving Average
BY MIKE BURNICK, CONTRIBUTING EDITOR, MARKET MINUTE
Stocks have enjoyed a robust relief rally over the past month after tariffs were paused in early April. The move was capped in spectacular fashion this week with news of a temporary tariff truce between the U.S. and China.
Now the question is, will it last…?
That is, both the tariff truce and stock market rally.
The good news is the S&P 500 and the Nasdaq were both able to reclaim their 200-day moving average (MA) early this week.
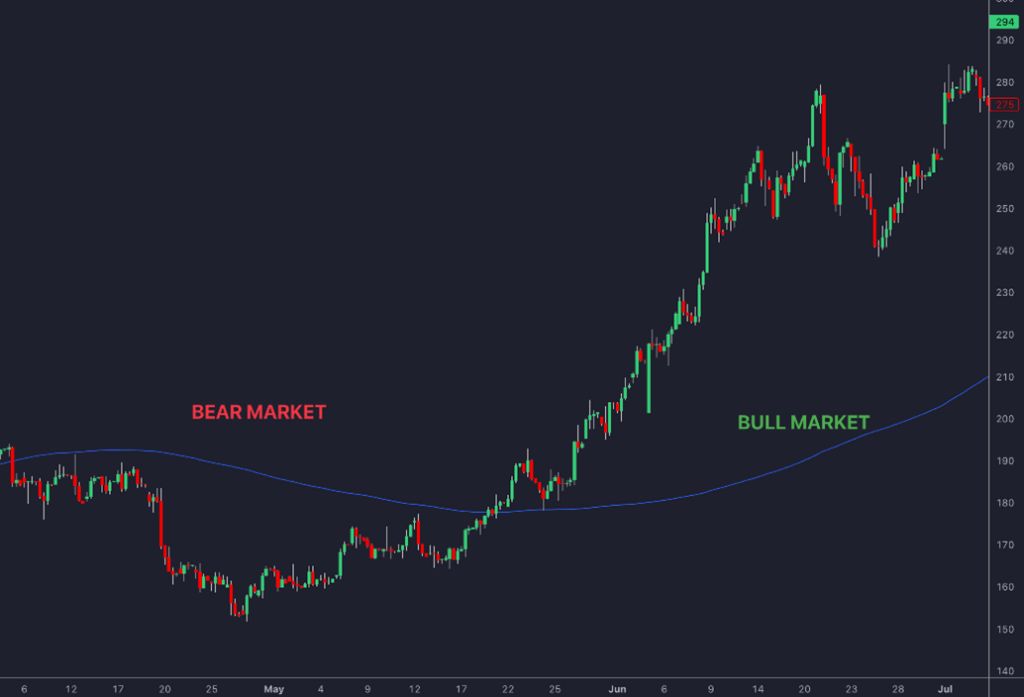
That’s a key technical level investors watch closely. When prices are above the 200-day MA, it’s considered an uptrend.
And when price is below… well, nothing good tends to happen in a downtrend.
In fact, according to a study by Fidelity, the S&P 500 delivered average returns of 11.9% annually when above this key moving average. That compares to a -4.3% yearly return when trading below it.
So, for now it looks like a spectacular reversal of fortune for the stock market, which is welcome news.
But just keep in mind… the S&P is only about 150 points (or 2.7%) above its 200-day MA. This means stocks are just one bad day away from slipping into a downtrend again.
Speaking of moving averages, historical research also shows the more S&P 500 component stocks are above their own 200-day MAs, the better the gains for the overall market index.
And this metric may be bad news if you’re expecting more fast-paced stock market gains.
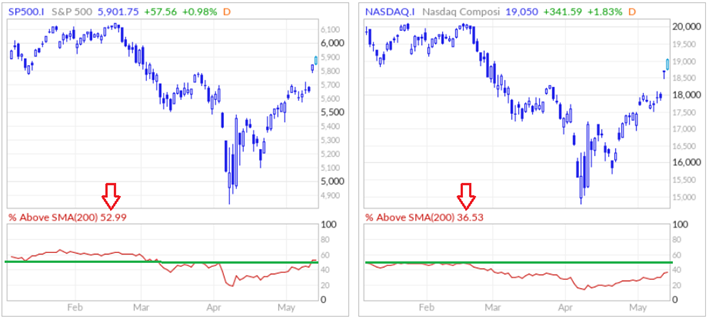
The charts above show the percentage of component stocks above the 200-day MA for both the S&P 500 (at left) and the Nasdaq (right). The upside participation has apparently stalled out.
For the S&P 500, breadth barely rose above the 50% mark. And for Nasdaq stocks, only 36.5% of them are above the 200-day MA right now.
Surprisingly poor breadth from the “rank and file” stocks. And that’s especially true considering the rip-roaring pace of the recent move from the April 7 low.
Mike Burnick’s Bottom Line: By several measures that Jeff shared recently, stocks are as overbought now as they were oversold in early April. And while more gains are likely for stocks over the next six to 12 months, I would not be surprised to see a market pullback first. In other words, odds are good we’ll see S&P 5500 again before S&P 6500.
Good investing,

Mike Burnick
Contributing Editor, Market Minute