
It was fun being bullish this week. Now, though, it’s time to jump back over to the bearish camp. The next few months could be tough for the stock market.
The Volatility Index (VIX) buy signal has run its course. From Friday’s low to Tuesday’s high the S&P 500 gained 240 points. That’s on par with the average gain of the previous five VIX buy signals.
So, if you “held your nose and bought stocks” as we suggested last Friday then you should consider taking your profits today.
As we head into December, and then 2026, things could get rough for the bulls.
Yes… we’re aware of the bullish arguments. The financial television talking heads have been chanting all week, “December is the third most bullish month of the year. The Santa Claus rally is heading our way. Seasonal trends are bullish through April.”
Yada. Yada. Yada.
But, seasonal trends this year haven’t played out. September and October, for example, tend to be bearish months for the stock market. Yet, the S&P 500 gained 3.3% in September. It tacked on another 2.4% in October.
In November, which is supposed to be one of the strongest months of the year, the S&P 500 is down 1.5% for the month so far as we kick off the final day.
So, how about we set aside the bullish expectations for December for a moment and take a look at the last time the market bucked the seasonal trends from September through November? To do that, we have to go all the way back to 2007.
Here’s a chart of the S&P 500 for that year…
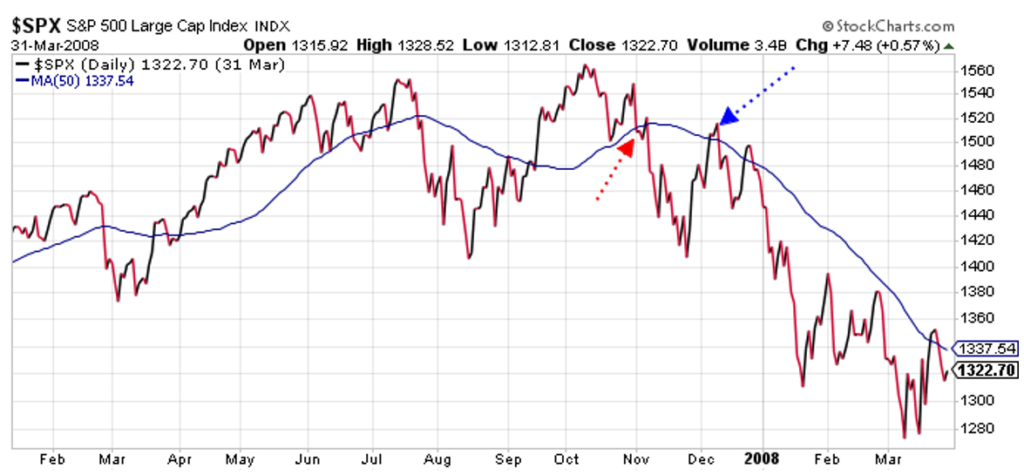
In September 2007, the S&P 500 gained 3.6%. The index gained another 1.45% in October. Then, in November – in what is supposed to be one of the most bullish months for the market, the S&P dropped 4.2%.
Most notable, though, is the index crossed below its 50-day moving average line in early November, sold off hard, and then rallied back to test the line as resistance in early December. Resistance held, and the S&P turned lower. It then went on to lose 15% in the early weeks of 2008.
Now let’s compare the above chart to what is happening in the market right now. Here is the current chart of the S&P 500…
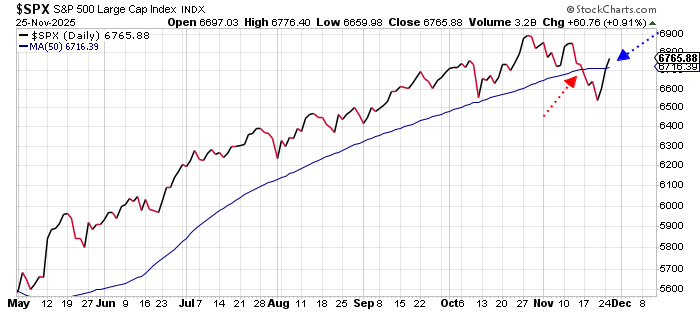
Two weeks ago, the index crossed below its 50-day moving average line and then dropped – hard. It has since rallied back and is now testing the 50-day MA as resistance.
This is a critical spot.
If the index can press higher and close above the mid-November high at about 6850, then no problem. The current bounce will likely continue, and there’s a good chance we’ll see new highs by the end of the year.
On the other hand, if the current bounce runs out of gas and the S&P turns back down, then look out below. We’ll have a series of lower-highs and lower-lows in place. That’s the definition of a downtrend – which means stocks could be headed sharply lower in the weeks to come.
There are a lot of similarities between the market action back in 2007 – just before the Great Financial Crisis – and the action this year. While history doesn’t have to repeat, it does often rhyme. And, the current setup is reason enough to be cautious for the short-term.
Best regards and good trading,

Jeff Clark
Editor, Market Minute
Free Trading Resources
Have you checked out Jeff’s free trading resources on his website? It contains a selection of special reports, training videos, and a full trading glossary to help kickstart your trading career – at zero cost to you. Just go here to check it out.