
Managing Editor’s Note: Today, we’re hearing from our contributing editor Mike Burnick in his weekly Thursday feature.
Mike has over 30 years in the investment and financial services industry – from operating as a stockbroker, trader, and research analyst, to running a mutual fund as a registered investment advisor and portfolio manager, to being Research Director for the Sovereign Society, specializing in global ETF and options investing.
And he’s been senior analyst at TradeSmith for three years, running Constant Cash Flow, Infinite Income Loop, and Inside TradeSmith.
Here’s Mike…
The Market Will Be Up 10% Three Months From Now
BY MIKE BURNICK, CONTRIBUTING EDITOR, MARKET MINUTE
Market volatility is nearly off the chart… and that’s great news!
The CBOE Market Volatility Index (VIX) the stock market’s “fear gauge,” has gone ballistic in recent days. That’s not surprising given the tariff-trauma induced stock market meltdown.
But here’s the thing… extreme highs in the VIX are often reliable buy signals for stocks.
Granted, I wrote in Market Minute last week that “when volatility is exhausted so is the selling.” And historically it has been a tried-and-true indicator that stocks should soon find a bottom.
But in this case, the signal was a bit too early.
The VIX had made a lower high at the same time the S&P 500 made a new low. That’s often an early indicator of stocks finding a low. As it turns out, the VIX wasn’t done rising, and it spiked to new highs above 60 on Monday.
But the good news is, that doesn’t cancel out the VIX buy signal indicator. In fact, the spike to new highs makes it more likely stocks will reach a bottom soon.
Take a look:
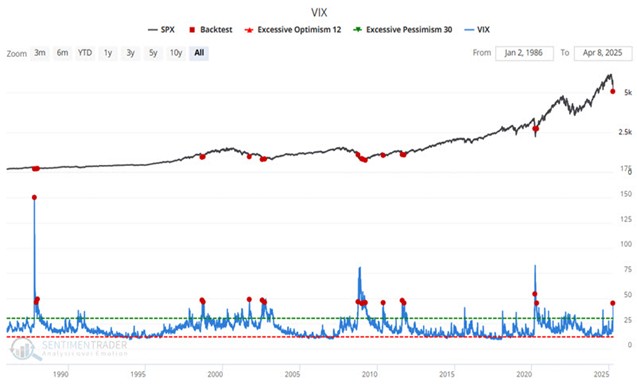
In the chart above you can see the history of this indicator with the S&P 500 at the top of the chart, and the VIX (blue line) at the bottom. Historically, when the VIX has spiked to 45 or higher, which it did this week, it’s a sure-fire sign of excessive investor pessimism.
This VIX buy signal for stocks has flashed 17 times since 1987. This week was the 18th signal.
The question is, what happens to stocks historically after the VIX spikes above 45?
- 3 months later the S&P 500 is up 88% of the time with 10.8% average gains
- 6 months later the S&P 500 is up 94% of the time with 16.55% average gains
Mike Burnick’s Bottom Line: Granted, this indicator isn’t 100% accurate… few are. And there’s always that 6-to-12% chance that stocks are still lower in three to six months’ time. Stocks could move lower near term before the rally begins, but there’s less than a one in three chance of that.
The odds overwhelmingly suggest stocks will be higher within three to six months, and for my money, I’ll bet with high odds like this every single time.
Good investing,

Mike Burnick
Contributing Editor, Market Minute
Free Trading Resources
Have you checked out Jeff’s free trading resources on his website? It contains a selection of special reports, training videos, and a full trading glossary to help kickstart your trading career – at zero cost to you. Just click here to check it out.