
You don’t have to be bearish to be looking for the stock market to pull back in the short-term.
The relentless rally off the April low has created overbought conditions, which is generating multiple caution signs – many of which we’ve written about in Market Minute.
The proverbial rubber band is quite stretched to the upside.
Even bullish traders, who expect the broad stock market will be much higher in the months ahead, ought to be careful chasing stocks in the current environment. We’re likely to see lower prices in the days ahead.
Look at this chart of the S&P 500 along with its Bollinger Bands…
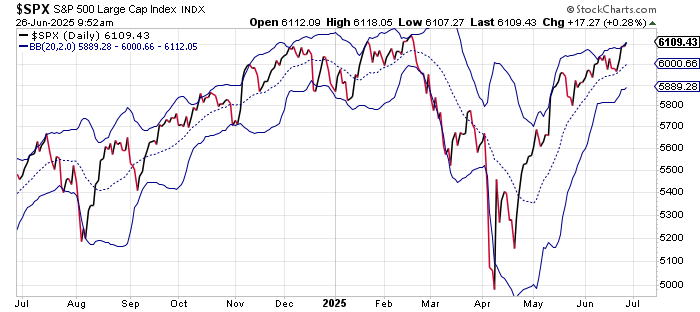
Bollinger Bands show the most probable trading range for a stock or an index.
As you can tell from this chart, the upper Bollinger Band (BB) has proved to be solid resistance for the S&P 500. Anytime the index has approached its upper BB, it turned lower within just a few days.
Some of the declines were mild – like the small, 70-point pullback we saw last week. Other declines were more significant – like the 250-point decline in one week investors endured last July.
At the very least, any upside the S&P gained while in this condition was given up in the days ahead.
Admittedly, I am leaning bearish. So, my bias is to look for evidence that supports a bearish argument.
But, even bullish traders should struggle to look at the above chart and argue for an immediate, sustained move higher in the short term.
Folks who are looking to put money to work in the stock market ought to hold off at least for a few days. There’s a good chance we’ll have a better opportunity to buy stocks at lower prices in the days ahead.
Best regards and good trading,

Jeff Clark
Editor, Market Minute
Free Trading Resources
Have you checked out Jeff’s free trading resources on his website? It contains a selection of special reports, training videos, and a full trading glossary to help kickstart your trading career – at zero cost to you. Just go here to check it out.