July was a fantastic month for the bulls.
The S&P 500 started July at 3775. It finished the month above 4100. That’s nearly a 10% gain in just one month.
And it provided some relief to weary investors and traders who’ve been punished hard this year.
But – and this is probably the most important “but” you’ll hear this year – the market is not likely to repeat July’s performance in August.
In fact, if history is any sort of a guide, stock prices will probably be lower at the end of the month than where they are today.
And they could be much lower in the months to come…
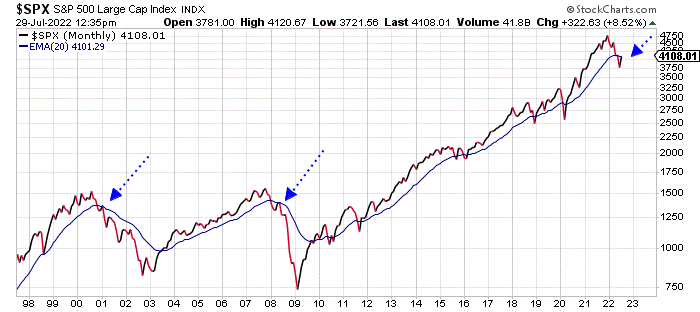
Look at this long-term chart of the S&P 500 plotted along with its 20-month exponential moving average (EMA – blue line)…

This chart is simple. If the S&P 500 is trading above its 20-month EMA, then we’re in a long-term bull market. If the index is below the line, then the bear is in charge.
You can see how breaches of the line – in late 2000 and early 2008 – led to significantly lower stock prices in the months that followed (blue arrows).
Since this is a monthly chart, all that matters is how this picture looks at the end of each month. And the S&P 500 ended June below the line.
But just as bull markets don’t go straight up, bear markets don’t go straight down.
One month ago, technical conditions were quite oversold and investor sentiment (a contrary indicator) was horribly bearish. The market was setting up for at least some sort of oversold bounce. And that’s what we got in July.
Notice how the S&P has rallied back up to “kiss” the 20-month EMA from below (right blue arrow). The index is now at a critical level.
If the S&P 500 continues higher and can finish August well above the line, then no problem. We’ll be back in bull market mode. That’s what happened during the breaches of the line in December 2018 and March 2020.
But if we start to sell off again in August, then the pattern will look more like 2001 and 2008 – and we all know what happened back then…
So, it makes sense to be a little conservative here as we head into a new month. Especially, since the traditionally weak months of September and October are ahead.
The bulls have had the momentum over the past three weeks. That can certainly continue in the coming days.
But what really matters is how the market ends the month of August. Historically, it looks like there’s more trouble ahead.
Best regards and good trading,
 |
Jeff Clark
Reader Mailbag
How will you be more conservative with your trades in the months ahead?
Let us know your thoughts – and any questions you have – at [email protected].
