
For today’s Market Minute, I figured we would do something a little different…
I decided to unlock part of my first weekly live call of 2026. This is a benefit my Delta Report subscribers have access to every Monday at 9am ET.
I go through what I see setting up in the markets, trade ideas, sectors I expect to do well (or poorly) and more in about 10 minutes.
Check it out right here, or feel free to read the transcript below instead.
Hi folks, Jeff Clark here. Welcome back to the first Delta Direct live recording of 2026. Happy New Year. Today is the last day of the seasonally bullish period that includes the last five trading days of 2025 and the first two trading days of 2026, also known as the Santa Claus Rally period. And so far, Santa is a no-show.
The S&P 500, I think, started off this period at 6,915, and we are considerably below that. Although, who knows? Today’s a new day. The events over the weekend are being interpreted by the market, at least, as being quite bullish, and the S&P 500 futures are up 27 points this morning. So we’re off to the races again.
I won’t talk anything about the situation with Maduro other than to say that the market seems to like it.
Energy stocks, which were very poor performers in 2025, are starting off 2026 as the number one sector to be in. And I think what we’re in for… I wouldn’t chase the energy stocks higher in today’s move. You know, most of them are going to gap up 8%, 9%, 10%, so I wouldn’t chase them on this. But I would use any opportunity, if you get a pullback over the next several sessions back to where they were, perhaps, on Friday, as an opportunity to position if you do not have positions in that sector.
As I’ve mentioned many times over the past several weeks, the energy sector is probably the cheapest and most value-oriented sector in the market. And I like the way the stocks look. I would have appreciated it if we had delayed taking over Venezuela until this week, when I had an opportunity to make a few recommendations early on, but I won’t let that burden anybody here.
So let’s get right into it. Let me share the screen with you and show you what I’m looking at.
This first chart is the S&P 500.
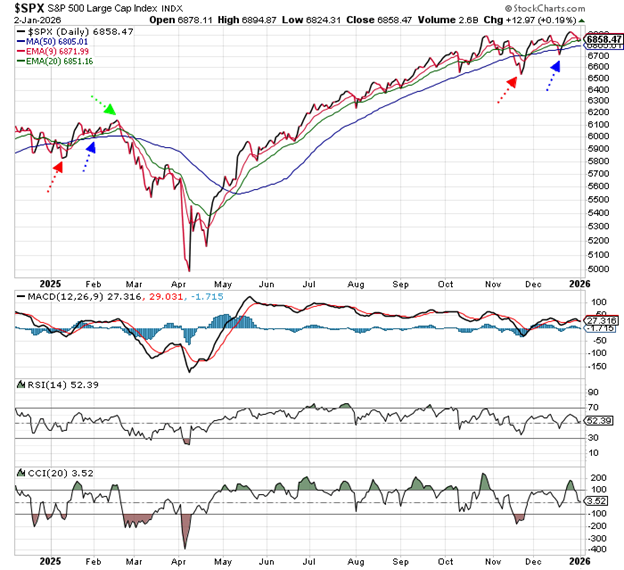
I had mentioned before the two-week break we just took that this setup looks really eerily familiar to how we set up in early 2025. You see the red arrows match, the blue arrows match, and the question becomes: where is this green arrow going to appear on the right side of the chart?
Basically, if we’re playing out the same roadmap, it’s possible that the high we made a week and a half ago is the high at 6,929. It’s also possible that maybe there’s enough fuel in the tank to get us up one more time to another new high before the market finally gives us a peak and a rollover into an intermediate-term downtrend.
I do think we’re headed toward an intermediate-term downtrend sometime in the next couple of weeks. It wouldn’t surprise me at all if it were to start next week, once we get the enthusiasm over the Venezuela situation out of the way. But as we are right now, we entered today slightly oversold, so there’s some fuel in the tank to push things higher.
We’re in the last day of the seasonally bullish period. The cautionary part I have to say is that the VIX is on a broad stock market sell signal, and the VIX is actually trading higher this morning. The VIX is up about 5%.
Before I talk about the VIX, let me talk about this.
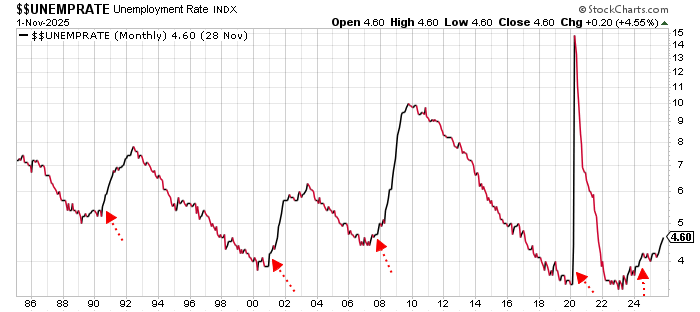
The jobs number is coming out on Friday. The past several jobs numbers have been relatively poor, and you’ve seen the unemployment rate spike up to 4.6%. As an absolute level, 4.6% is still considered full employment, so it’s nothing to worry about by itself. But these red arrows on the chart I’m showing correspond to the yield curve.
When the yield curve has gone from an inverted state to an upward slope, that’s where the unemployment rate has been at those times. And you can see all of them preceded a rather large spike in unemployment over the next several months. This is a monthly chart, so it takes a while to play out.
If I were looking at this as a stock chart, the unemployment rate looks really bullish. It’s an uptrend with higher highs and higher lows, and it’s accelerating higher. Friday’s number is going to be very important. If we see another uptick, I don’t know if that’s the topping point for the market, but it’s something to keep in mind.
In my adult lifetime, we’ve only had four other times where we had a yield curve inversion turn back into an upward slope. All four times preceded relatively difficult economic times and relatively difficult stock markets. As much as I’ve harped on this chart for the past year or year and a half, I’m going to keep harping on it because I do think it’s significant for what we’re going to face in 2026.
I won’t spend a lot of time on that today because we’re going to focus on short-term stuff, but it’s something to keep in the back of your mind, especially as we get into Friday.
All right, let’s look at the VIX real quick.
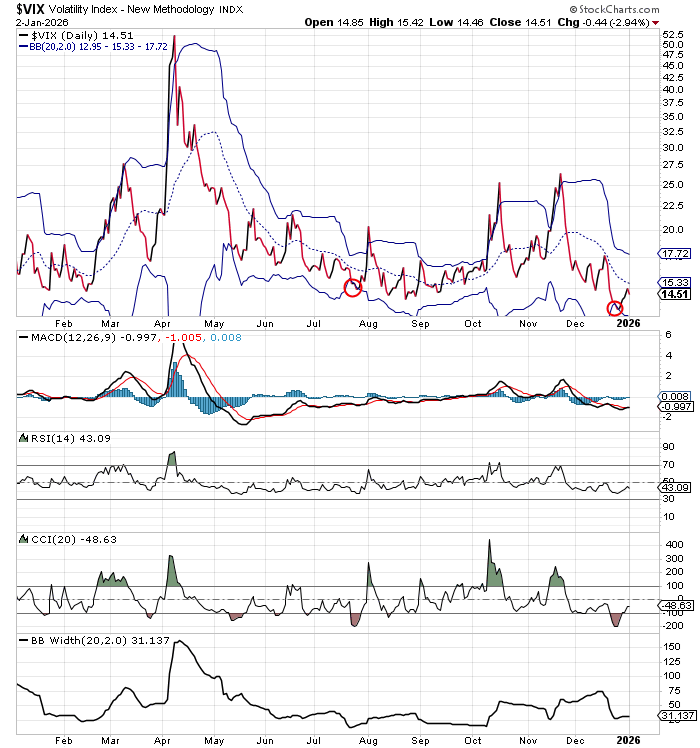
The VIX was trading below its lower Bollinger Band last week, and it came back inside the band. That gives us a VIX sell signal on the broad stock market.
VIX sell signals are fairly rare. Maybe we get one or two a year, as opposed to buy signals, where we’ll often get five or six a year. VIX buy signals tend to play out immediately. VIX sell signals tend to be a little bit delayed. The last one we had was in late July, right before the S&P 500 fell about 300 points.
We got one last week. It wouldn’t surprise me if the S&P 500 is on the verge of making an intermediate-term top and this signal eventually proves to be confirmation of that. Pay attention to the VIX. It’s higher this morning while the market is trading higher, which is always a warning sign.
My bottom line is that I think there’s probably a day or two of strength in the market, fueled largely by the energy sector. But I think ultimately, over the next several sessions, we’re going to put a top in place and enter maybe a two- or three-week pullback. Be on the lookout for something like that.
That said, as I’ve mentioned multiple times over the past several weeks, we’ve got a bifurcated market. We’ve got a lot of stocks that have been selling off and a lot of stocks that have been rallying. Those that have been selling off have been making consistently lower lows but putting positive divergence in place, which is bullish. Those that have been rallying have been making higher highs but with negative divergence, which is ultimately bearish.
You should see those things flip-flop. A lot of the underperforming stocks might actually start performing pretty well. I just want to share a couple of them with you – not that I’m trading any of them here. Do your own homework and see if there’s something you like.
This is Super Micro Computer, SMCI.
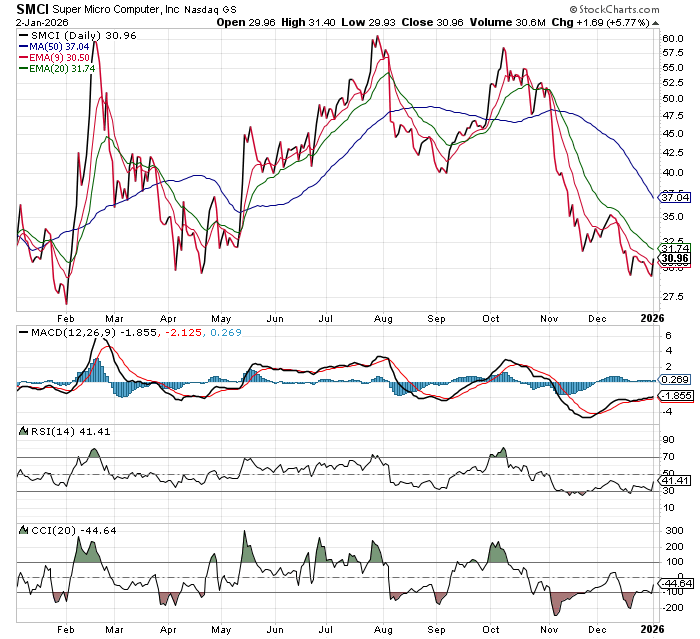
It used to be a darling of Wall Street and has been a bit of a bummer over the past few months. You can see how it sold off, made a series of lower lows and lower highs, but with positive divergence. The most recent lower low was right before New Year’s, and we’ve got a nice little spike higher that should prove to be a higher high.
If it can come back down and make a higher low with this positive divergence in place, that would provide a pretty good opportunity. It closed Friday at 30.96, so I’d look for something close to the $30 level as an opportunity to put money to work if we get that chance.
Here’s another one, Grocery Outlet.
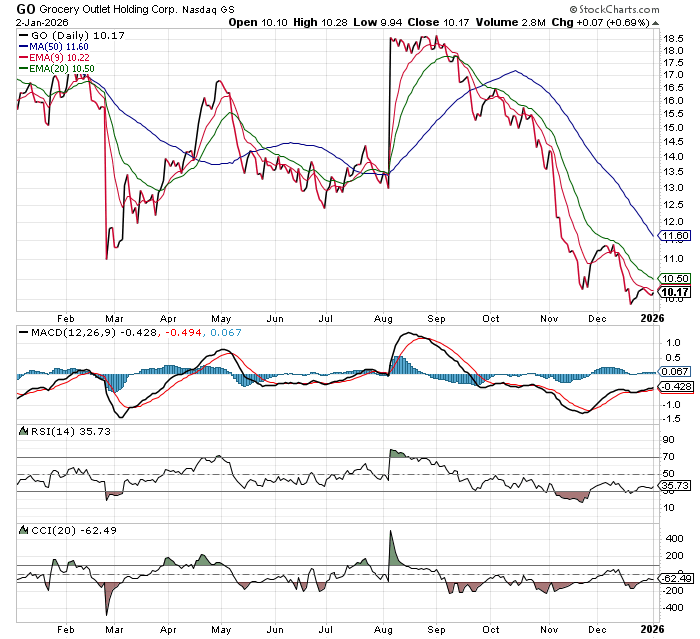
I don’t know much about the stock other than it’s a discount grocery chain, but the pattern looks pretty positive. You’ve got lower lows, lower highs, another lower low, but with positive divergence. I think last week’s low is going to prove to be a higher low, and the stock probably works higher, maybe back up to the 50-day moving average.
Another one – this will be my 2026 weight-loss trade – is Peloton.
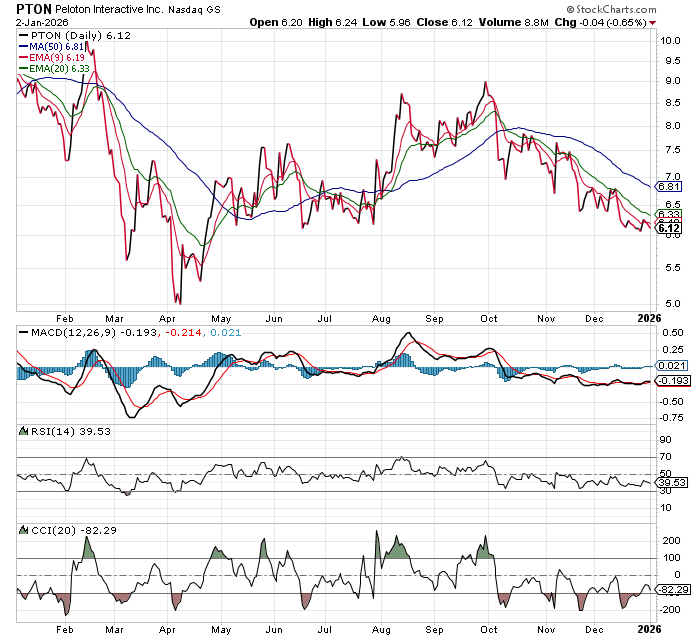
I had no interest in owning this stock for a long time because I thought it traded at a relatively high multiple for what is essentially exercise equipment. But look at this: you’ve got a tight wedge forming with positive divergence and the potential for a higher low.
On a nice spike higher, this could be a $7 or $7.50 stock, which would be a nice percentage return from the $6 level. I haven’t even looked at the options because it’s a $6 stock and doesn’t really require them. Those are some of the things I’m looking at from the long side.