
I wanted to touch base with you about the turmoil in the markets right now.
The last time I did a video like this was back in September. And the bottom line was, I said short term, the markets looked bullish. But ultimately, the effect of the yield curve was going to have a not so comfortable effect on the broad stock market.
That’s where we are now. However, that’s not a reason to panic. Bear markets create fantastic buying opportunities. I’ve talked about this a lot.
I think we’re going to have a generational buying opportunity this year, not unlike what we saw back in 2008, where stocks traded just so unbelievably low that you had some incredible opportunities to buy.
I’m looking forward to that. But in the meantime, you have to be willing to resist the emotion of selling based on fear and panic and buying based on the fear of missing out.
Check out my video below, or scroll down to read the transcript.
Transcript
Hi everyone, it’s Jeff Clark here coming to you on a bright, well maybe not so bright, but definitely an early Tuesday morning.
Wanted to touch base with you really quick about all the turmoil that’s happening in the stock market right now. The last time I did a video like this that went out to all my subscribers was back in September. So a good seven months ago and it was right before the Fed was widely expected to lower interest rates. You might recall that.
That was I think September 4th or 5th that I put the video out there. You can go back in the scrolls and see, maybe even review it if you feel like it. But back then I spent a lot of time talking about the inverted yield curve and what the Fed’s reduction of interest rates would do to that yield curve and then how that yield curve would affect the broad stock market.
And the bottom line takeaway to that was, you know, at the time the S&P 500 was trading around 5600. And I said short term, it looked bullish. Maybe we can get to 5,800, maybe 5,900, something like that. But ultimately, the effect of the yield curve was going to have a not so comfortable effect on the broad stock market.
And so ultimately, we projected something down around 5,200 or so would be eventually where the broad S&P 500 winds up making its way. So here we are seven months later. And in fact, all of that has happened. So what I wanted to do today is spend a little bit of time and
We’ll look at the yield curve again and we’ll project kind of what I think is going to happen in the broad stock market from here. let me give me just a second to figure out how to share my screen and I’ll put that out here for you.
All right, here we go. So right here, this is the yield curve.
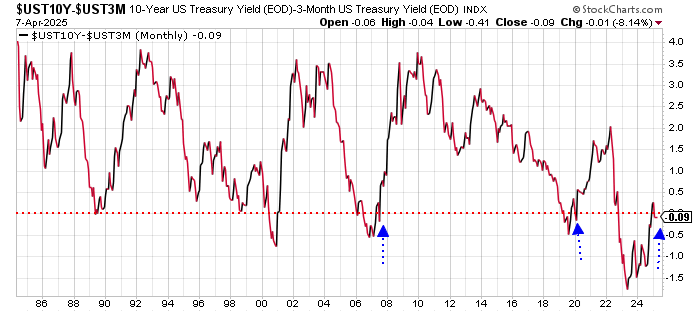
And again, just as a quick recap, the yield curve is basically if you take the 10-year treasury note, the yield on the 10-year treasury note, subtract the yield on the three-month treasury bill, you get what I consider the important yield curve. And typically it’s an upward sloping yield curve, meaning that the yield on your 10-year bonds, 10-year notes, should be higher than the yield on the three-month bill.
And it just makes sense. The longer you go out in time, the longer you’re willing to lock up your money, the higher rate of interest you expect to get. An inverted yield curve is when that’s the opposite. It’s when short-term rates are higher than long-term rates. And as we’ve talked about before, and I’m sure you’ve heard on the news and any other commentators to talk about this, the yield curve is often, or an inverted yield curve is often a signal of a recession.
My argument has always been it’s really not the inversion of that yield curve that creates the economic situations that causes turmoil in the stock market. It’s when the yield curve goes from an inverted state back to an upward slope.
So when you go into negative territory and then you come back above that, that’s usually what creates the turmoil in the stock market and also in the economy. And we’ve had several examples of that over time.
I mean, you can go back to 1990, you’ve got that situation. You’ve got the situation in 2001, following the dot-com bust. You’ve got the situation in 2008, which was the great financial crisis. And you have the situation back in 2020, which was of course the COVID situation.
And now you have a condition where we’ve gone from the deepest inversion of my lifetime, my adult lifetime anyway, and the longest inversion, back to an upward slope, and you’ll see that we’ve noted this on the chart here.
When you look back in time, you look at the situations that have developed when the yield curve has gone from an inverted state back to an upward slope, I mean, it’s always been during periods of economic turmoil. And part of that is because the Fed has to lower interest rates. Part of it has to do with the economic conditions that create the situations, recessionary, it’s all these sorts of things.
I think this is very important to understand as we go through 2025. There’s a problem here. This correcting of the yield curve from an inverted state back to an upward slope is, I think, a very significant situation. I mentioned it back in September. We were way down here back in September. We still had a very deep inversion. But with the Fed lowering short-term rates, and you recall what I talked about at the time.
They lower short-term rates, it’s also obviously going to create a situation where the long-term rates wind up going up. So you have the short-term rates going down, the long-term rates going up, and you have this back into an upward slope.
And this is what’s happening. Now, we don’t usually just stop at this and then start to invert again. That would be abnormal. Oftentimes, you get the move back into positive territory, then a retracement back to the line, and then it really takes off.
And you saw that in 2008 and you’re seeing it, you saw it in 2020. And I think you’re seeing it right now where we bumped above. We’ve come on back down because of the recent market action. And I think we’re going to accelerate higher again. So I think we’re in a situation where the Fed is going to wind up having to lower short-term rates.
And the process of that is going to increase the long-term rates, the rate of interest on the longer-term treasury notes. And you’re going to get back into a situation where you have a more normal slope to the yield curve.
But again, the problem with that is that’s usually bad news for the stock market. So let’s take a look at the S&P 500. I’ll share with you a little bit of what I think has happened and what I think is going to happen.
Here’s the chart of the S&P 500.
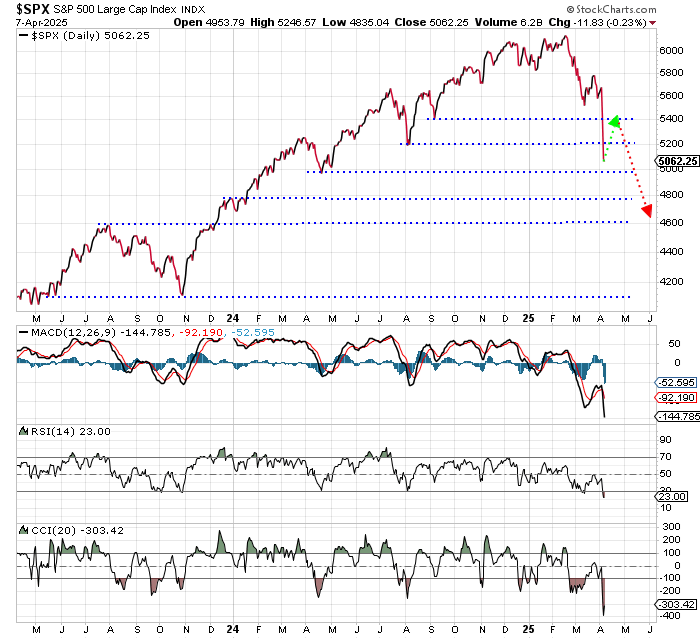
You recall the last time we got together on a video was back in early September. And we were sitting right around here, right around the 5600 level, right before the Fed lowered interest rates.
My argument at that time was I thought the lowering of interest rates would be short-term bullish for the stock market, which it proved to be, but it would be intermediate- and long-term bearish.
So I argued at the time that if the S&P 500 did get up to my target, which then was 5,800 to 5,900, most folks ought to be using that strength to sell stocks, take some profits off the table because when the market comes back down, you want to have some cash to be able to buy.
And the only way you’re to be able to do that is if you actually sell some stocks into strength. Well, this actually took a little bit longer than I thought it would, but we’ve seen that action. The market held up for a while. But what we’ve seen recently, we came all the way back down. see, in September, I talked about a 5,200 downside target.
We’ve exceeded that. We’ve gotten to, I think it closed yesterday, 5062. We actually traded down to 4,835 yesterday. So that was a very significant intraday drawdown.
But going forward, here’s what I think is going to happen. Conditions are now oversold. Well, let me back up one second. What I want to talk about is I think this is obviously the start of a bear market. Maybe not so obvious, but in my opinion, it is the start of the bear market. I think this markup here, the 6,150, is going to be proven to be the high for 2025.
I don’t think we get above that level again this year. It’s the next year or the year after that maybe we can claw our way back up to that. But that’s not a reason to panic and that’s not a reason to be overwhelmingly bearish or be dismayed or anything else because bear markets create fantastic buying opportunities. I’ve talked about this a lot.
You actually have, I think we’re going to have at some point this year, really a generational buying opportunity, not unlike what we saw back in 2008, where stocks just traded so unbelievably low that you had some incredible opportunities to buy.
And so I look forward to being able to do that, but the only way you can do that is if you actually take some profits off the table during these uptrends that we’ve had. So hopefully, hopefully you did some of that.
If not, you’ll have some opportunities because you will get some wicked oversold bounces.
So we’ll end it there.
Have a wonderful trading day. Take care.
Best regards and good trading,

Jeff Clark
Editor, Market Minute
Free Trading Resources
Have you checked out Jeff’s free trading resources on his website? It contains a selection of special reports, training videos, and a full trading glossary to help kickstart your trading career – at zero cost to you. Just click here to check it out.