
The stock market has been quiet lately… too quiet.
On Friday, for example, the S&P 500 traded within a ridiculously tight trading range, and closed nearly unchanged for the day. That’s quiet for any given day. But, it’s especially quiet for an option expiration day.
Then yesterday the market opened higher – with the S&P 500 gaining 35 points during the first hour of trading. But, the index didn’t move more than four points for the next five hours – before drifting lower in the final 30 minutes and closing up just 0.14%.
The lethargic action has pushed the Volatility Index (VIX) to its lowest level since February. And, the VIX Bollinger Bands are the most contracted they’ve been all year.
Traders should pay attention to this condition. Because, as we’ve seen time and again, low levels of volatility are always followed by high levels of volatility – and vice versa.
The VIX has been declining for 14 weeks. It has reached what is widely considered to be a “low level.” And, the chart is showing signs that the trend is ready to change.
Take a look…
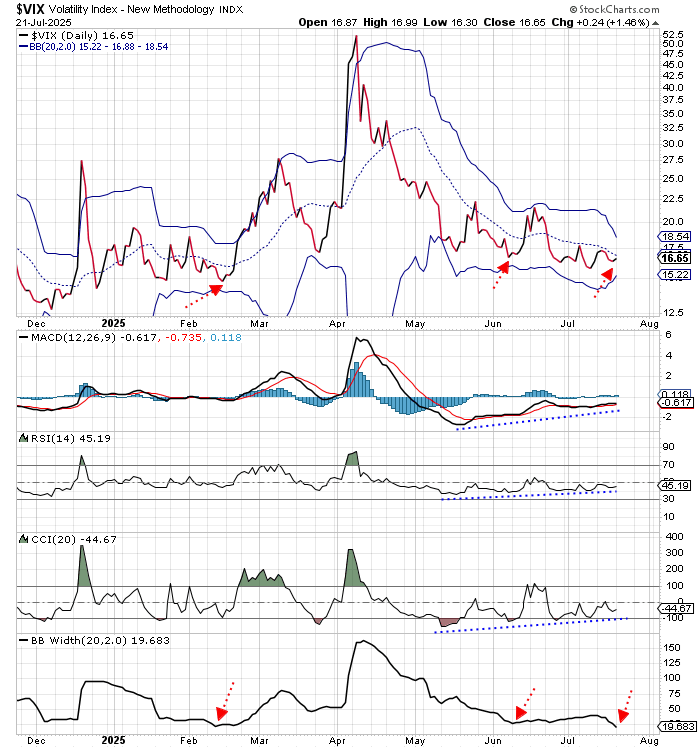
As the VIX has been declining over the past several weeks, making a series of lower lows and lower highs, the momentum indicators at the bottom of the chart have been rising. This sort of “positive divergence” is often an early warning sign of an impending rally.
More interesting, though, is the width of the Bollinger Bands – the blue lines on the VIX chart.
While the VIX has been declining, the Bollinger Bands have been contracting. They’ve been pinching together, to the point where the distance between the bands is as narrow as it has been all year.
The last two times the Bollinger Bands were pinched this close together was back in February and early June. Each time, this condition led to a sharp and immediate rally in the VIX.
And, a rally in the VIX usually coincides with weakness in the stock market.
In June, that weakness resulted in a relatively modest 100-point decline in the S&P 500 in about two weeks. In February, though, the S&P made a significant intermediate-term top and ended up declining 1,100 points over the next seven weeks.
There’s no way to know what sort of decline might be in store this time around. The only thing we can be sure of is periods of low volatility are always followed by periods of high volatility. And now, with the VIX Bollinger Bands pinched so close together, there is plenty of energy available to fuel a large move.
Best regards and good trading,

Jeff Clark
Editor, Market Minute
Free Trading Resources
Have you checked out Jeff’s free trading resources on his website? It contains a selection of special reports, training videos, and a full trading glossary to help kickstart your trading career – at zero cost to you. Just go here to check it out.