
If you’re like millions of other Americans, you probably made a New Year’s resolution recently.
Maybe to save more, cut down on calories, or spend more time in the gym.
If so, here’s an uncomfortable truth…
How long you stick to that resolution has less to do with discipline than timing.
You see, most people don’t abandon good intentions at random. They do it on a schedule.
That idea first caught the attention of a Wharton professor named Katy
Milkman in the early 2010s. She wasn’t interested in motivational speeches or willpower. She focused on something narrower – and stranger. Not why people decide to change, but when.
What she found was remarkably consistent. Decisions to diet, exercise, save, or invest didn’t spread evenly across the year. They clustered tightly around a handful of dates: Mondays, the first day of the month, birthdays, and – above all – January 1.
To test the pattern, Milkman and her colleagues looked at gym check-ins, Google searches, and enrollment records for self-improvement courses.
Right after these so-called “fresh start” dates, effort surged. Diets began. Savings plans were opened. Gym attendance spiked.
Then, just as reliably, it faded.
The insight wasn’t that people lack willpower. It was that human behavior runs on a calendar. Motivation rises and falls on a schedule, whether we notice it or not.
Once you see that, an even more interesting question follows: If individual decisions surge and retreat at predictable moments, what happens when millions of people make those shifts at once?
Markets, after all, are nothing more than the sum of those decisions.
It’s a question my team and I at TradeSmith set out to answer in 2024 with the help of thousands of lines of computer code and quintillions (billions of billions!) of market data points.
Closing the Gap With Wall Street Elites
If you don’t know us already, TradeSmith is the creator of a leading financial technology platform, based in Baltimore, Maryland.
Today, we help more than 134,000 people around the world monitor more than $29 billion in assets. And Forbes, The Wall Street Journal, and The Economist have profiled our breakthroughs.
We’ve built tools to help everyday investors track portfolios, manage risk, and spot opportunities. We’ve even created, tested, and released a popular AI-trading model.
We were confident we’d find some seasonality patterns in how stocks trade. But what we discovered surprised even us.
It turns out that thousands of stocks showed historically reliable windows – specific times of the year when they tended to rise, and others when they tended to stall or fall.
We call them “green days.”
And based on these green days, we built a trading system designed to act on them – pinpointing bullish seasonal windows on roughly 5,000 stocks, down to the day. In backtests, those trades succeeded with an 83% historical accuracy rate.
First, it helps to understand that seasonality isn’t some new invention. It has shaped markets for a long time.
Traders Have Always Tracked Cycles
Commodity traders have always tracked planting and harvest cycles. Energy markets move with heating and cooling demand. Gold has long shown seasonal strength tied to jewelry demand and annual buying patterns in India and China.
Stock investors, too, have noticed calendar effects.
The January Effect. Quarter-end rebalancing. Even the old saying “Sell in May and go away.”
What’s changed isn’t that seasonality suddenly appeared. It’s that we can now measure it precisely – across individual stocks, over decades of data, and down to specific days.
Take Target (TGT).
For all the volatility surrounding the retailer in recent years, one pattern has held with striking consistency. Between June 22 and July 21, Target stock has risen an average of 5.2%, climbing 100% of the time over the past 15 years.
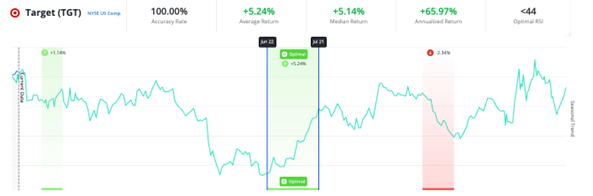
That pattern held again in 2025, when the stock gained 10.3% during its seasonal window – long after pandemic-era distortions faded.
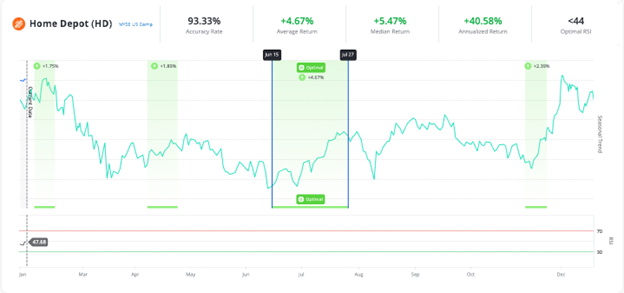
Home Depot (HD) shows a similar rhythm.
Between June 15 and July 27, the stock has risen 93% of the time over the past 15 years, with an average gain of 4.7%. In 2025, it followed the same script, rising 6.7% in just over a month.
These aren’t one-off coincidences. They’re examples of a broader phenomenon that only becomes visible when you analyze markets through the lens of timing rather than narrative.
Using our Seasonality tool, we’ve tested this approach across thousands of stocks, indexes like the S&P 500 and Nasdaq, and even currencies and commodities.
Over an 18-year backtest, seasonal trades generated 857% total growth – more than double the S&P 500’s return over the same period.
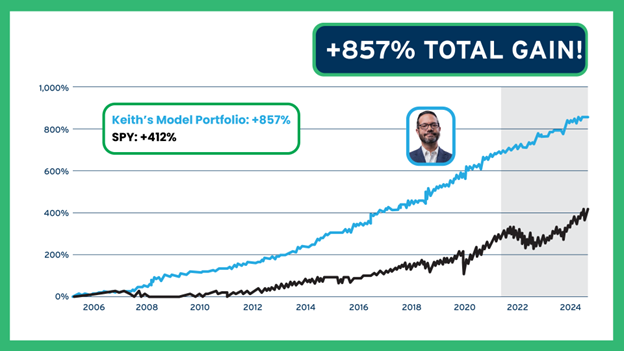
Even in 2007, the weakest year in the test, the strategy produced a positive return, with gains of more than double the S&P 500 over the same time.
Circle These Dates on Your Calendar
That’s why we’ve made a version of our Seasonality software available for you to explore now.
We’ve unlocked access so you can see the seasonal “green days” for thousands of stocks yourself ahead of our Prediction 2026 event.
It kicks off Tuesday, January 20, at 10 a.m. Eastern. And I hope you’ll join me. I’ll be getting into more detail about the fast-approaching seasonality patterns you need to be aware of.
I’ll also walk you through how we uncovered these patterns, why they persist even in chaotic markets, and how you can use them to guide real-world trading decisions.
Knowing when the windows are opening and closing likely matters more to your wealth than any single resolution you’ve made.
The first date you’ll want to circle on your calendar is Jan. 28. If seasonality patterns hold this year, it could open up the most lucrative trading opportunity in decades.
I hope you’ll join us.
Keith Kaplan
CEO, TradeSmith