
Lots of folks are betting against Meta Platforms (META) right now.
The stock has not had a down day since Mark Zuckerberg got caught leering at Jeff Bezos’ girlfriend during President Trump’s inauguration. As of Friday, that was 20 straight days of gains.
It is one of the most remarkable streaks in stock market history. And, lots of folks are betting on it ending… soon.
But, that bet may not pay off too well. While the streak is destined to end at some point, it doesn’t mean shares of META are destined to tumble.
Yes, META is overbought. Yes, the technical conditions are quite stretched to the upside.
But, there are two ways the market can relieve those conditions. META could indeed decline, as many folks are betting on happening. Or, META could simply mark time – chopping back and forth in a tight trading range – for a few weeks.
Based on the current technical setup, I’ll bet on META chopping around for a bit.
Take a look at this chart…
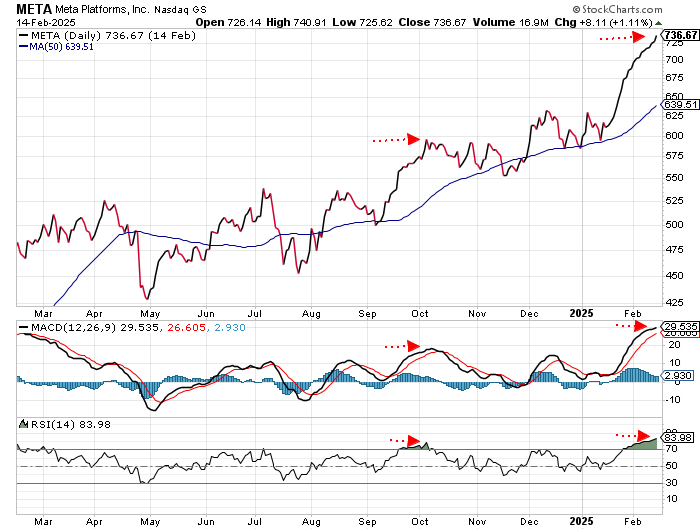
META rarely trades more than 7% away from its 50-day moving average line before it reverses course and heads back towards the line. Last Friday, META closed more than 15% above its 50-day MA.
This is an “extremely overbought” condition.
The last time META was in this condition was in early October when the stock closed 14% above its 50-day moving average line. One month later, META was trading for the same price.
Rather than declining, shares of META chopped back and forth long enough for the 50-day MA to catch up with the price of the stock, and for the technical momentum indicators at the bottom of the chart to fall back to neutral territory.
That’s the sort of action we’re likely to see when META’s current winning streak finally ends.
Free Trading Resources
Have you checked out Jeff’s free trading resources on his website? It contains a selection of special reports, training videos, and a full trading glossary to help kickstart your trading career – at zero cost to you. Just click here to check it out.
Take a look at the MACD and RSI indicators at the bottom of the chart. They are well into overbought territory – which is a warning sign.
But, as META has been pressing higher, these momentum indicators have been pressing higher right along with the stock.
This action confirms the strength of the current trend. There isn’t any “negative divergence” to suggest a reversal will happen anytime soon.
That doesn’t mean META won’t pull back. But, it does suggest that any immediate decline is likely to be mild.
In other words, rather than correcting the current overbought condition with a decline in the share price, META is more likely to correct over time.
The stock is set to chop back and forth for a while – thereby giving the 50-day MA a chance to catch up to the current price of the stock…
And frustrating all of those folks betting on a sharp decline.
Best regards and good trading,

Jeff Clark
Editor, Market Minute