
Managing Editor’s Note: Keith Kaplan – CEO of Tradesmith – is going to tell us about “the biggest breakthrough in Tradesmith’s history.”
It’s a way to consistently use seasonality trends to find the absolute best times of year to buy and sell any asset…
And best of all, it’s based on measurable, tangible patterns.
At 10 am ET today, Keith will tell you more about this breakthrough… why the system is predicting a major shift in the stock market on July 30… and how you can profit by embracing a “rapid-fire” new type of investing…
So make sure you sign up right here.
Why I’m Worried About You During This Melt Up
BY KEITH KAPLAN, CEO, TRADESMITH
It was the first Big Short.
In the summer of 1929, Jesse Livermore – the most famous trader of his day – quietly reversed course.
After riding the roaring bull market for the previous year, he sensed the turn.
The headlines were still euphoric. Stocks were shattering records and pulling people from all walks of life into the stock market.
But experience had taught Livermore that it’s better to sell early into strength than get caught in the downdraft.
So, as the crowd piled in, he sold all his stocks – and began preparing to short the market (bet on stocks falling).
From his private “war room” in the Heckscher Building on Fifth Avenue, he began building bearish positions in overextended stocks. To keep things quiet, he changed brokers constantly, used more than 100 accounts, and even tracked his trades with secret chalkboard symbols no one else could decipher.
His preparations paid off… spectacularly.
By the time Black Tuesday hit, on Oct. 29, he’d made $100 million – $1.7 billion in today’s money. This made him one of the richest men in the world.
And it all came down to one simple truth: Markets move in cycles. Not just boom and bust cycles, but also seasonal cycles that repeat year after year.
Some seasons reward risk. Others punish it. The key isn’t constant action – it’s knowing when to act.
“There’s a time to go long. A time to go short. And a time to go fishing,” Livermore said.
And he meant it.
During slow stretches – especially in summer – Livermore would disappear to his yacht off Montauk and fish for swordfish.

Jesse Livermore aboard the Anita Venetian with his catch. (Source: The Trend Follower)
The hard part, of course, is timing these seasons.
Livermore used his instinct and his experience as one of the world’s greatest traders.
My team of top data scientists and computer programmers set out to solve the same problem by running 50,000 tests a day across 33 years of stock market history.
Our Seasonality tool analyzes all that data to pinpoint the calendar dates when stocks – even entire indexes – tend to turn.
We’ve found stocks that hit their seasonal inflection points with 83% back tested accuracy.
And right now, the data is pointing to something big.
On July 30, our system is predicting a major shift in the stock market.
Not a crash, like in 1929. But it’s the kind of bearish seasonal pattern Livermore would have watched closely – even if from the deck of his boat.
In just a few hours, I’ll be hosting a special online event to walk you through what’s coming. I’ll also show you how to profit by embracing a “rapid-fire” new type of investing
Make sure to register for that here. Once you do, you’ll get free preview access to the seasonal charts our tool produces for more than 5,000 stocks and the major indexes.
Today, let’s go through the latest seasonality chart for the S&P 500. Pay close attention to the shift coming up at the end of the month.
Are You Ready for the Coming Market Shift?
Take a look at the chart below…
Green shaded areas represent times when the index tends to go up. The white areas are times when the index tends to fall.
As you can see, it’s been prime time for the S&P 500 since the end of June.
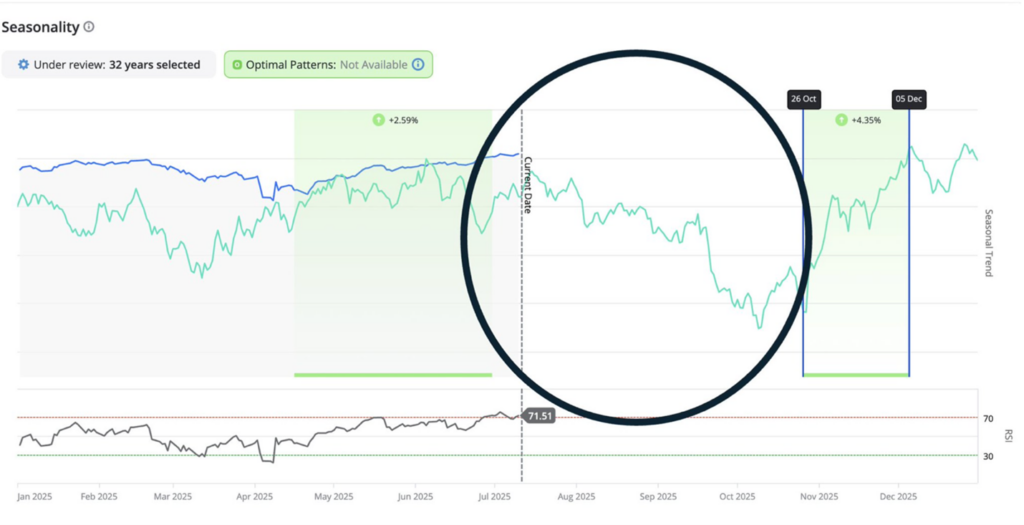
The June 28 to July 28 window has produced gains 15 years in a row.
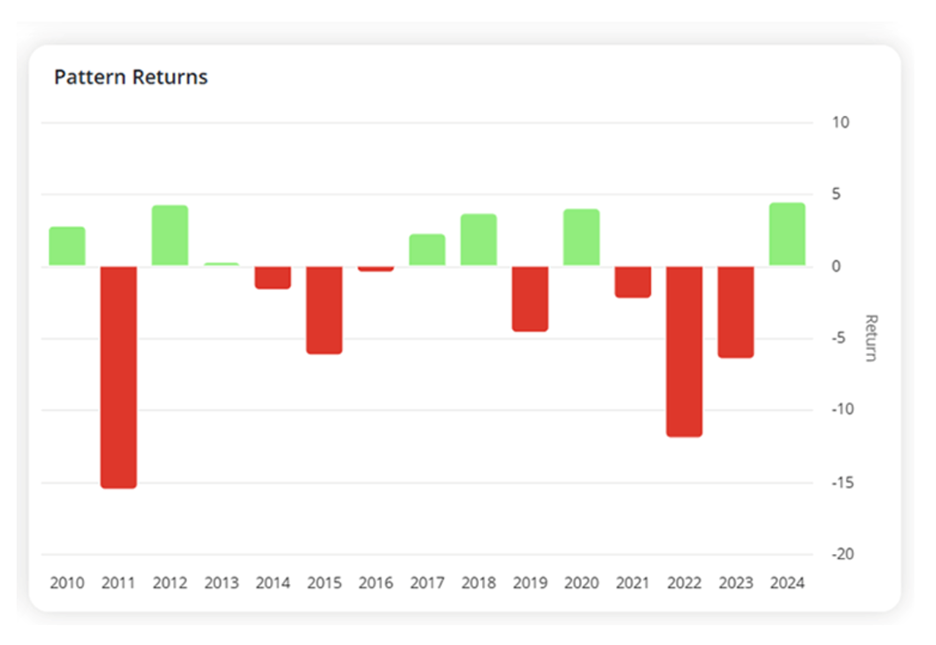
Over the past 15 years, the return for the S&P 500 has dipped below 2% only five times – and it’s often been much higher.
For instance, in 2016, 2020, and 2022 this seasonal window delivered a gain of more than 6%.
We’re in the eye of that bullish storm now.
But following this bullish window, we get a major regime change (circled area on the chart above). After topping out around July 28, the market tends to stumble.
Historically the S&P 500 has fallen more than half the time over the next three months, with an average return of MINUS 1.8%.
Interestingly, big gains in this window – like in 2010, 2018, 2020, and 2024 – have often set the stage for downside at this time during the following year, such as 2011, 2019, and 2021.
Remember, this coming market shift isn’t a reason to panic. I’m NOT recommending you step away from the market entirely.
But you do need to prepare to take profits quickly during the regime change that’s coming.
That’s exactly what I’ll be getting into during my upcoming seasonality event today at 10 a.m. eastern.
In the meantime, take a look at the gains our current seasonality subscribers have been able to rack up on individual stocks by combining our system’s signals with the power of options trading.
- 112% on Hasbro (HAS) calls in 10 days
- 107% on Aon (AON) calls in 23 days
- 124% on Booking Holdings (BKNG) calls in 15 days
- 180% on Analog Devices (ADI) calls in 14 days
- 248% on Intuit (INTU) calls in 15 days
No wonder it’s been such a huge hit with the first group of traders who had the courage to try our seasonality tool when we unveiled it in January.
In fact, it was one of the most successful launches we’ve had at TradeSmith in our 20-year history.
But we’re always growing… and always improving. I’m currently collaborating with Louis Navellier of InvestorPlace on a special bonus for seasonality subscribers. And my upcoming seasonality event will mark the next leap forward.
When you sign up, you’ll get free access to seasonality charts on the webinar website and can take a closer look at the seasonality patterns for market indexes like the S&P 500 and your favorite stocks.
See you in a few hours.
All the best,
Keith Kaplan
CEO, TradeSmith