
Managing Editor’s Note: Today, we’re hearing from our contributing editor Mike Burnick in his weekly Thursday feature.
Mike has over 30 years in the investment and financial services industry – from operating as a stockbroker, trader, and research analyst, to running a mutual fund as a registered investment advisor and portfolio manager, to being Research Director for the Sovereign Society, specializing in global ETF and options investing.
And he’s been senior analyst at TradeSmith for three years, running Constant Cash Flow, Infinite Income Loop, and Inside TradeSmith.
Here’s Mike…
Why the Dow Theory Keeps Me Cautious…
BY MIKE BURNICK, CONTRIBUTING EDITOR, MARKET MINUTE
Last week, I pointed out that several reliable sentiment indicators (i.e. contrary indicators) are flashing red for the stock market.
As if that didn’t warrant a cautious stance, seasonality also turns negative for stocks in exactly one week and a day from now, on Friday, August 1.
Well, there’s another class of indicator known as confirming (or non-confirmation) indicators. And one of the oldest, Dow Theory, is also flashing red right now.
Here’s the lowdown on Dow theory…
It was created 125 years ago by Charles Dow, co-founder of The Wall Street Journal and namesake to the Dow Jones Industrial Average (DJIA). It’s a visual, chart-based method to classify the ebb and flow of market trends, both uptrends and downtrends.
The basis of Dow Theory is comparing the DJIA to the lesser-known Dow Jones Transportation Index (DJT). These two indexes should confirm each other in a healthy trending market. And when they diverge, that’s a red flag for the stock market overall.
Back in Charles Dow’s day, DJIA was just 12 stocks chock full of heavy industrial firms including General Electric (GE), the only original DJIA stock remaining. And DJT was full of mostly railroad stocks.
Today, the DJIA is a broader list of 30 stocks including tech giants Apple and Microsoft, among others. And DJT is mostly airline or air freight companies, including American Airlines and FedEx, with a few railroads remaining.
But both indices still represent some of the biggest and most influential American companies.
DJIA stocks represent the production of goods and services, while DJT stocks represent the distribution of products (and people) both nationwide and internationally.
That’s why the two indices are expected to confirm each other in a healthy market uptrend. In other words, both production and transportation should be in sync.
Otherwise, something’s amiss in the economy.
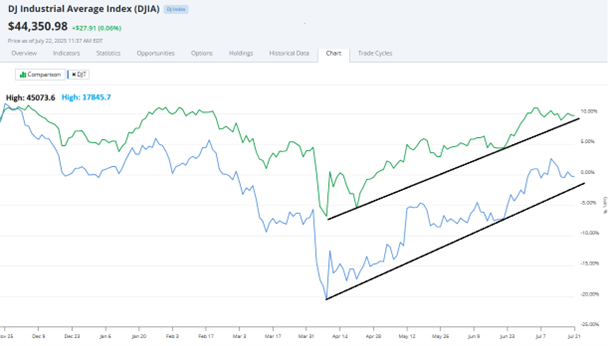
As you can see in the chart above, both indices have trended higher in unison since the April low. But there are some glaring non-confirmations, too…
- DJT is lagging behind DJIA in performance, with DJIA up 3% this year while DJT is flat
- Also, neither index made a new all-time high this year, while the S&P 500 has.
- DJIA is in the TradeSmith Health indicator green zone, while DJT remains red.
Bottom line: These inconsistencies, or non-confirmation, between the Dow Jones Industrials and the Dow Jones Transports isn’t a guarantee that stocks will suffer. But it tells me to exercise caution, especially as we enter the seasonally weakest two months of the year for stock market performance.
Good investing,

Mike Burnick
Contributing Editor, Market Minute