Dear Reader,
Rachel Bodden, Jeff Clark’s senior managing editor here…
Our next podcast is in… and it’s a good one.
Today, Jeff tells us his thoughts on the markets, takes us behind the scenes of how he uses the new TradeSmith widget, and answers some subscriber questions.
And remember, let us know your thoughts – good or bad – or send us questions at [email protected].
Check it out below, or see the transcript on the website or the Jeff Clark Mobile App (you can find the Android version here and the Apple version here).
Regards,

Rachel Bodden
Senior Managing Editor, Jeff Clark Trader
Transcript
Rachel Bodden: Hi, my name is Rachel Bodden. Welcome back to another podcast with master trader Jeff Clark. Today we’re going to have a rundown of what Jeff sees in the markets. And then we’re going to take you through the new TradeSmith widget and show how that can be applied to your trading.
And if we have a little bit of time, we’re going to go through the feedback that you have been sending to us. And we’d like to thank you for sending so much positive feedback on this series. We love to do it and we’re happy to continue. But remember, we can’t answer questions if you don’t send anything in. Good, bad, or constructive criticism, we’re all open to it.
So, Jeff, what’s the market doing for you today?
Jeff Clark: Doing for me, not much. Doing for everybody else seems to be working out okay. As we sit here on what day is it? Is it Tuesday? On a Tuesday afternoon, the markets are all time highs. The S&P is just bucking the seasonal trends of bearishness. It’s bucking the Buffett indicator. It’s bucking everything. So the momentum here is, know, obviously the momentum is with the bulls. And that’s a little bit frustrating for me since I am not a momentum trader.
So I’ve been largely on the sidelines, you know, just a few trades here and there and we’re doing okay with them. But, you know, it was interesting. I was having a phone conversation with a buddy of mine yesterday and I was talking about, you know, my own frustration with the market, you know, it just doesn’t seem to get anything going. And he was equally as frustrated. Now this person is a technology fund manager and I thought he would be having a great time, you know, cause it’s a tech market.
But he was telling me one of his largest positions is IBM. And if you look at a chart of IBM, IBM peaked six weeks ago. He owns Microsoft, which has been a good performer. He owns Meta, which has been a good performer. But he’s got a handful of semiconductor stocks like Marvell Technologies, which is down on the year.
He’s got, I don’t know, he listed a whole bunch of things that are actually down on the year. And surprised me a little bit. And it was really just sort of illustrative of that, the fact that, you know, this market has been moving higher with fewer and fewer stocks participating.
That’s usually a poor sign for forward returns, but while it’s happening, obviously, if you are chasing momentum here, you’re doing pretty well. If you’re buying ALAB, which is up 300 % this year, you’re doing great. If you’re buying Nvidia, which is up 100 % off of the April lows, you’re doing great. But the thing that I would want to impart on folks, if I’m talking to my mother or I’m talking to my brothers about this, I’m focusing on the risk side of things. And when you buy stocks that are trading 150 to 200 times earnings that have already tripled in value, you’re putting up a lot of risk to capture that extra return. And I don’t think the potential rewards at this point justify that.
I am going to err on the side of being too conservative. And I know that’s going to frustrate a lot of folks as you know, they read the headlines every day and it’s stock markets going straight up. But at the same time, we’ve been in this position before we were in something similar in February, we saw something similar happen at the end of 2021. And the forward returns of the market tend to be what’s the word suboptimal. So I’m not looking necessarily for a crash.
I was very bearish a few months ago, I thought really that we would have a generational buying opportunity come around September, October. I don’t think we’ll get that low. think anything significant is probably going to be pushed back until maybe January, February, something along those lines. But I still, I find it very, very difficult as a fundamental analysis analyst to look at the S&P trading 24 times earnings and think it’s time to pile into the market.
And as a technical analyst looking at some of these stocks that are so far above all of the various moving averages and the risk, the rubber band stretch so far, it’s really hard. So I am cash heavy at the moment, which looks like a fool’s position right now, but I have a feeling it’ll look like a pretty smart position.
not too long from now. And I’ll point out that there’s an awful lot of smart people on Wall Street that are very cash heavy as well. Warren Buffett being one, Steve Cohen being another, Michael Burr being another. I don’t mind sitting in those people’s company. So I am cautious on the market. I have sort of given up on the idea of shorting anything here with the hopes of making money as things fall because the market is not.
It’s not conducive to short selling at the moment. And it’s difficult to make money on the short side because you’re constantly second guessing yourself. You’re constantly thinking, do I let this one run or do I take the quick profits off the table?
And usually the smart move is to take the quick profits on a short trade. But again, in this particular market, it’s hard to battle that momentum. So sitting with a lot of cash, taking a shot every now and then, we’re doing okay on those shots that we take, but I am not being aggressive here at all.
Rachel: I mean, you don’t survive four decades as an options trader without being really good on your risk management. So I think that’s one of the reasons people gravitate towards you. You tell them to put down the ice cream when they don’t want to hear it, you know, and you have been proven to be right even when people get frustrated. So you’re doing something right, Jeff.
Jeff: Well, yeah, there’s some truth to that, but always in the back of my head, it’s, okay, what can I be doing different to add value to help subscribers profit a little bit better? And the problem that I’m facing right now is coming up with those opportunities that make sense to me from a risk reward standpoint. I often say that I usually only make recommendations that I would be willing to recommend to my own mother. I can expand that a little bit since my mom is in her mid-80s.
I could say, I’ll make recommendations for folks in their sixties or their fifties, but even then it’s very, very difficult for me to come up with ideas that make sense from a risk reward perspective. There’s just the things that are moving right now are the things that have the most risk attached to them. And it’s paying off, you know, it’s like sitting down at the roulette wheel and you know, black two comes up all the time. You just keep betting on black two.
But the odds of that happening are getting thinner and thinner and thinner. Just for me, it doesn’t make a lot of sense to take a lot of risk in the market at this particular juncture.
Rachel: I think that’s very, very fair. And I know I’m biased, but I’ve been in this industry a while, worked with a lot of really fantastic and not so fantastic editors, but I’d always prefer my editor err on the side of caution. I don’t want you to just make trades just to make them. So I always want to know that you have my best interest at heart. And I know that you do. And I know that our subscribers know it as well. So I think that’s a really good point to transition to our new TradeSmith widget.
And how you would go through and sort of screen those companies so that our subscribers can maybe do that on their own if they want.
Jeff: Okay, well, just to introduce it a little bit to folks, it used to be that I would spend hours and hours and hours every Saturday morning and I would go through chart after chart after chart after chart, hundreds, maybe even thousands of them. I never sat down and really counted them. And it would take me a good portion of the day, eight, nine, 10 hours. And I would be hunting for charts that looked interesting to me. And as most of you know, my particular style, I trade two types of setups.
I trade what we call convergence setups, is where all of the various moving averages have come together. There’s a lot of energy building, and there’s a big move coming out of that. And I trade divergence pattern, which is basically the rubber band philosophy, which is, know, look for things that are extended far below the moving averages, look for them to snap back, or look for things that are far above their moving averages and look for them to come back down. And that’s my style of trading.
The momentum stuff I’ve never found a home in that. It’s not really my wheelhouse. So I concentrate on convergence and divergence. And I spend a lot of time going one by one through charts to do that. When I came on board with Tradesmith, Keith Kaplan said to me, he says, I can make your life so much easier. We’ll use technology and you just tell us what it is that you’re looking for. And if you can quantify it, that would be wonderful. And then we’ll put together a widget that will spit those names out. And you know, I’m cynical.
I’ve never been a systems trader because I think systems don’t evolve well enough. know, the market moves back and forth, people’s emotions change a little bit depending on how stretch conditions get. And so the technical formations, what worked six months ago doesn’t necessarily work today. And what works today isn’t going to work six months from now. So systems tend to be a little bit too rigid.
Keith assured me that he could find a workaround with that. And so far, think he has. Essentially, happens is TradeSmith developed a widget for me which uses my two philosophies, one of convergence, one of divergence, and it spits out those stocks that fit into those particular patterns that I’m looking for. So what I’ll share with you, let me share the screen here, I’ll show you what shows up on the TradeSmith website.
All right, here on the Tradesmith website, this is the dashboard section and it has Jeff’s short term convergence. This is really convergence and divergence screen, but we’ll just stick with the name as it is right now. So this shows up and shows the top five contenders for the convergence strategy and the top five contenders that their system spits out, their widget spits out on the divergence strategy.
So we’ll go one by one through the convergence. You don’t have to get into the weeds on this and know what the risk quotient is or the RSI or what all this blue stuff means or anything else. Just note the stocks that it lists. These are the stocks that the widget has spit out as being the most potentially profitable trades in the convergence philosophy that I subscribe to, and the divergence philosophy that I subscribe to.
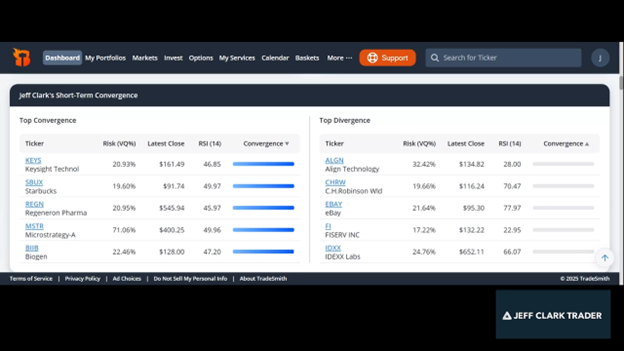
So if you take a look at these top five and you just one by one go through and look at the charts on them and we’ll do that as well. me stop this for a second. Just note these, we’ve got keys, we’ve got Starbucks, we’ve got Regeneron Pharmaceutical, MicroStrategy and what is that, Biogen. So now that we’ve got that out there, let me stop sharing on this one and I’ll share another screen with you.
All right, so this is my stock charts screen. I’m just going to type in the first one that showed up on the convergence, and we can go one by one through these if you like. So this is Keysight Technologies, K-E-Y-S is the symbol. And you’ll see what I’m talking about when I talk about the convergence. You see these moving averages. These are the 50-day moving average in blue.

The 20-day exponential in green and the nine-day exponential in nine. These are the three that I pay the most attention to. You see they’re all converging together. So what that’s telling you is the stock is in a really tight trading range. It’s not going too far above or too far below. Everything is getting tight and there’s energy building for a big move. And if you look at the technical indicators, momentum indicators at the bottom of the chart here, you’ve got the MACD, the RSI and the CCI. Again, knowing what these do, not that important, but knowing that they’re all in neutral condition tells you that energy is building. It’s not overbought nor oversold. So you’ve got everything come together price-wise converging and everything coming together momentum-wise. All of these are converging. So there’s a big move coming in one direction or the other for keys.
Of course we don’t know which direction it’s headed. So in terms of the strategy that you might incorporate off of something like this, if you liked Keysight Technologies, if you thought this was a stock I absolutely have to own, then this is probably a good time to buy it because it’s on the verge of a big move one way or the other. And if you don’t mind paying 166 bucks a share for it, then it makes sense to own it. Keep in mind though, that there is risk to the downside because again, lot of energy, but we don’t know which direction it’s moving.
But if you had a bias towards it, if you thought the stock was a good fundamental stock down, I don’t know anything about this stock, by the way, so I’m not making a recommendation one way or the other, but you do have the potential for a big move. As an option trader, one of the things I would look at with this is I would go over the option market and I would price out and see what the calls at roughly a 165 strike price would cost and what the puts at a 165 strike price would cost. And if it’s not too expensive, I might buy one of each, you know, and play both sides.
So if I get a big move higher or a big move lower, big move higher, I profit off the call, big move lower, I profit off the put. So that gives me the potential for what we call a long straddle position. So that’s one of the ways I might trade something along these lines. Let me give you another example, some of the other stocks that were out there. Starbucks I looked at earlier, it didn’t look all that interesting to me. It hasn’t really been consolidating long enough. Everything’s tied together.

And all of the momentum indicators are in neutral, so it passes that test to be included in the widget. But I would probably wait for this chart to fill out a little bit more. Maybe if it’s stuck around this particular price level for the next two or three weeks, then we can look at possibly putting a trade together for it. Regeneron was another one on the convergence chart. And this looks interesting.

You can probably tell why I might be attracted to it because here again, you’ve got the stock that’s trading at a low level consolidation pattern. All the moving averages are tied together. Everything’s in neutral. And I would be willing to bet if I was taking a look at Regeneron fundamentally, it’s probably in the lower area of its valuation range. So this might be interesting from a buyer’s perspective. Maybe we’ve got some upside coming with it.
Another one that looked interesting that was on the chart here is MSTR.
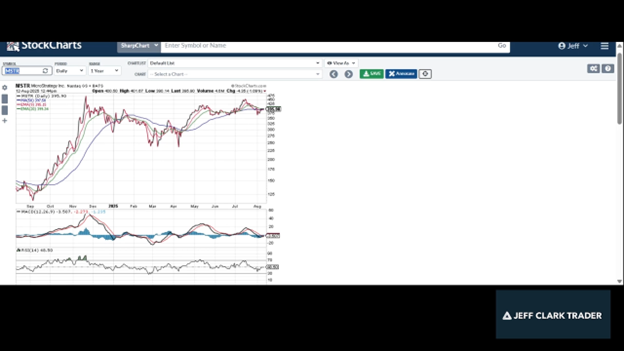
This is MicroStrategy, which we all know is Michael Saylor’s company. It’s basically a Bitcoin treasury company. They buy a bunch of Bitcoin and they sit on it. And you can see how it has consolidated here. We’re now in a very tight convergence pattern. The moving averages are very tight together. All the momentum indicators are neutral. So there’s a big move coming. What makes this particular one interesting is MicroStrategy tends to tip the hand as to where Bitcoin is headed. So if micro strategy breaks out to the upside, you might use that as an indication that Bitcoin is moving substantially higher. If micro strategy breaks down from here, you might use that as an indication that Bitcoin is probably headed lower. So you can use micro strategy in this case, whichever way it goes, as an indication of where Bitcoin is headed.
And then the final one on that convergence pattern is Biogen.

Same thing as Regeneron, it’s in the biotech sector. And again, you’ve got this very tight, lot of energy building. This looks relatively attractive to me from a fundamental standpoint. It’s in the lower area of its valuation ranges and it is, like I said, developing a lot of energy. So there’s probably a big move coming one way or the other. If you like the idea of owning Biogen, this is probably a good time to buy it. I’m not making that recommendation. I’m just simply saying from a valuation standpoint and a potential movement standpoint, that’s what’s showing up in the widgets. Now the other ones on the widgets, those were, you know, share my screen once again.
Those were divergence categories on the widget. So we’ve got Align Technology, CH Robinson, eBay, Pfizer, and IDEX. Now these, rather than being stocks that are building a lot of energy where the moving averages have come together, these are where the moving averages are very far apart and where the relative strength is showing either oversold or overbought condition. For example, you can see RSI. 50 would be neutral, so much below 50, like Align Technologies at 28. That tells you it’s oversold. CH Robinson at 70, it’s a little bit overbought. eBay overbought. Fiserv oversold. IDEX overbought. I’m not going to go through all of them, but let me pick one that I thought looked really interesting. Fiserv is probably a good one.
Yeah, technology is my best friend. That was sarcasm if you didn’t catch that. All right. So there’s Biogen. Let me show you Fiserv. This one looks really interesting to me.
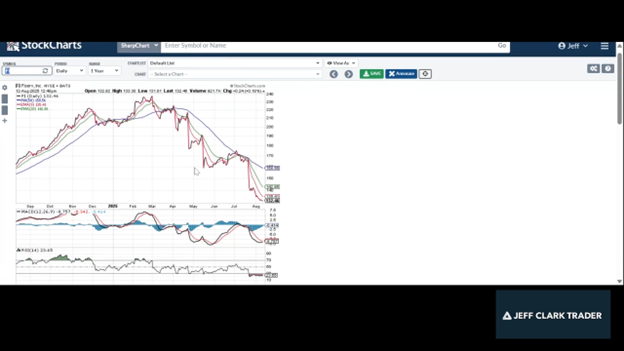
You can see how it’s oversold, right? All the moving averages are far apart and the stock is historically far below its 50-day moving average.
I like to see in a rubber band situation where I’m looking for a snapback move, I like to see this sort of a development where, you know, Pfizer typically trades within 10%, the 10 % range of its 50-day moving average. And you can see it’s probably something closer to almost 20 % at this point. So 50-days at 158, 132. So what is that? Maybe 18 % below its 50-day moving average. That’s an oversold condition. And you can see how far apart the moving averages are. Similar conditions in the past, you just go back to where it was in May and you can see the same sort of the thing.
The benefit of looking at stocks that are in this particular situation where they’re oversold, deeply oversold, or if we were overbought, would be deeply overbought, is there’s not a lot of energy here to keep that move going. So the downside risk here, I’m looking at the mid-May move, is relatively limited until things come back in line again, where everything comes together, you’ve got energy.
So here, once again, we’ve got an oversold condition. So this looks like the downside is relatively small. And if I look at the various momentum indicators, you’ve got the MACD deeply oversold. You’ve got the RSI deeply oversold, the CCI also oversold. You do have some positive divergence on the CCI, think I could see if I squint far enough. Positive divergence on the RSI and it’s starting to develop on the MACD. So I kind of like this setup for a move back towards the 50-day moving average. This was probably an earnings announcement that caused this stock to fall. I haven’t looked enough into it.
Like I said, this showed up on the screen this morning. So I kind of like this setup. This would be something that I would look to perhaps buy call options on. I might be tempted, depending on the premiums, to sell an uncovered put if the stock was cheap enough from a fundamental perspective. Again, the only time you sell uncovered puts, or the only stocks on which you sell uncovered puts, are stocks that you want to own and you sell puts at prices on where you’re willing to buy it. You don’t sell an uncovered put on a stock if you don’t want to own it. So if there’s no in the world, you’d want to own FiServ, you don’t sell an uncovered put on it.
But you could buy a speculative call option and if the price is right, perhaps make a decent trade along those lines. So that’s what I use this divergence side for. A lot of these trades right now, you know, they’re short term. We’re just looking for a move back towards the 50-day moving average and I’m just, I’m spit balling here, but if I look at the previous times where Fiserv got whacked, you know, got whacked here, it rallied back up to the 50-day, it got whacked again, it rallied back up to the 50-day, it got whacked again, didn’t quite make it to the 50-day, got to the 20, whacked again to the 50-day, whacked again. So a move to the 20-day gets us up to 142, a move to the 50-day, and this is declining, so probably be 150 over the next few weeks, a move up to 150. So stocks at 132.
I’ll take a bump up to 142 or I’ll take a bump up to 150. That seems to be the, may to be a pretty good risk reward set up when you don’t have a lot of downside potential. So I know I talked that covered it kind of quick, but hopefully that gives you an idea of how I would use the widget or how I do use the widget to come up with some of the trading ideas.
Rachel: That was incredibly informative even for me and I’ve been working with you for quite some time now. I loved being able to see that. So if you enjoyed seeing Jeff go through charts like that, let us know and we definitely need to have more and more ideas and what to talk to you about in our podcast. So help us help you. Jeff, would you like to go through the last few minutes of some questions from subscribers? All right.
Jeff: Sure, of course.
Rachel: Let me pull up some feedback and remember write to us at [email protected] we love hearing from you and we’ll definitely get to you in a podcast or maybe we’ll start putting back the mailbag in Market Minute. All right this is from subscriber Michael B. “Jeff, over the years you’ve been an avid trader of gold and silver. However, in the last year these metals have had massive gains. What is your vision for the future trades of gold and silver over the rest of the year?”
Jeff: Okay, that’s a great question because I do love to trade gold and silver stocks and I’ve been relatively inactive in making recommendations in that. And if you pull up a chart of gold and silver, you’ll see that they did have a pretty good run, but they’ve been sort of consolidating for the past several weeks. So we’re in one of those consolidation patterns where there’s a big move coming, I think, in gold. And it’s just a matter of guessing which direction it goes. We’ve got a Fed meeting coming up in September and the odds are increasingly on the side of the Fed lowering interest rates. And I think gold has been holding up rallying and silver has been rallying in anticipation of the Fed lowering interest rates. Whether or not they do it, I won’t get into an argument. At the moment, I don’t think they will, but that my opinion could change on that.
The market, I believe gold is anticipating that happening. So if the Fed does in fact reduce interest rates late September, I don’t think gold does anything. It’s already done it the Fed doesn’t reduce interest rates in late September, then gold becomes disappointed and you’ve got some downside. Gold has also, from a contrarian perspective, become a pretty popular trade.
Lots of folks like to buy gold right now. You know, Costco is selling gold bars like crazy. Lots of folks are buying silver right now. Lots of folks are buying the gold and silver stocks. So from a contrarian perspective, it keeps me a little bit cautious. And also from a seasonal perspective, I’m a little bit cautious on it. In Delta Direct this week, we just took a small put position in the gold sector.
And really, it’s plainly the overstretched situation and potential for a downside move in the metals that will show up first in the stocks. And so I’m slightly bearish. I don’t like to be bearish on the gold stocks because I love them. think the long-term potential for them is quite good. But I’m also very aware that markets are emotional in the short term.
And right now, I think the emotion has gotten a little bit too far ahead of itself on the bull side for gold stocks. And I think it’s probably overdue for a smackdown. I wouldn’t trade heavy that way, but I would look for lower prices to generate a potential buying opportunity. And I think aggressive traders might look at taking a short position. I’ll also point out that one of the indicators I use is the bullish percent index for the gold sector. It hit 100. Meaning 100 % of the stocks in that index are trading with bullish technical patterns. A lot of folks would say, hey, that’s wonderful. But really, it’s a measure of overbought and oversold conditions. So when you have 100 % of the stocks in the sector trading in a bullish pattern, it’s an overbought condition. It can’t get better than that. So it can only get worse, which means.
When it turns lower, it’s going to generate a sell signal. And BPGDM sell signals, and buy signals, by the way, are really, they’ve got a very good track record. So once that flips over, once it backs off a little bit, we’re going to have a BPGDM sell signal, which ought to weigh down the gold sector. So my outlook, my immediate outlook is rather pessimistic for the short term, but I think it will open up a pretty good buying opportunity, which often happens this time of year. Seasonally, gold stocks tend to be weak in August, September, first part of October, and they tend to do very, very well the fourth quarter of the year and the first quarter of the next year. So I think we’ll have a really good buying opportunity somewhere in late September, early October, probably coincident with a disappointing Fed meeting.
Rachel: And Michael B, if you haven’t seen this morning’s Market Minute, Jeff writes all about that as well. So next one is from Michael J. And he says, “enjoy the podcast, keep them coming.” We’ll work on that. His question is, “do you follow cyclical trading and if not, why?”
Jeff: I’m guessing by cyclical he’s intimating that it’s seasonal as well. And yes, I do, because I do think that, you know, there’s plenty of evidence that proves that there is seasonality in the market. You know, there’s a reason stocks tend to do well, January, February, March, they tend to get weak in April. They do well again in the early summer, then they get weak in the fall, September and October. I think as a backdrop, that’s a pretty good rule to work with. It’s not the dominant position. There’s lots of stocks that might be beaten up right now that seasonally would lead to more weakness, but look good from a technical formation that will probably do very well over the next several weeks. So I don’t want to make that the sole condition for it, but I try to pay attention to seasonality when I’m looking at making new recommendations, absolutely.
Rachel: Great. All right, next one is from subscriber Derek. “Hi Jeff, been a satisfied subscriber for a while now. On moving averages when charting, does simple moving average or exponential moving average matter all that much?”
Jeff: Well, that’s a loaded question. I’m going to say it doesn’t matter all that much because the difference is relatively insignificant. But what I have found is the majority of stocks, and I don’t know why this is, and it wasn’t the case 15 years ago when I first was getting really into moving averages, but it is the case right now that stocks tend to play a lot around the nine-day exponential moving average, the 20-day exponential, and the 50-day simple moving average.
If you were just to use all simple, you’re probably in the realm of coming up with the same sort of analysis that I would. Or if you used all simple moving averages, same thing. But if I’m looking for specific support and resistance areas, I think using the nine-day EMA gives me a better target. The 20-day gives me a better target, EMA. The 50-day simple gives me a better target.
It might be just a few pennies difference, but for whatever reason, it seems to be the case that those particular moving averages right now in this particular moment in time tend to be favored by the market. I think maybe that has something to do with the computer programmers running all the algorithms and everything else at the hedge funds. They punch in all those numbers and they use the 90 EMA, the 20-day EMA and the 50-day movement average. If they change back to simple, then we’ll adjust or if they change it to the eighth day or the 15th day or something else.
Rachel: Okay, we have our last question here from Kevin S. “Jeff, are we getting increasingly quote overbought because one, we’ve entered a new world of financial economics or two, we have a massive new generation of young investors who do not know what overbought truly looks like and means for future investing.”
Jeff: Okay, well, how about all of the above? I could probably spend five hours talking about this. There’s a couple of things that make this particular market environment different than what we’ve seen before. And I’ll preface everything by saying that if you watch any of the business shows, you get analysts on there all the time talking about how we’ve never seen this thing happened before. We’ve never seen this thing happen before.
In April, we were talking about how we’ve never seen a market sell off like that, where so much participation on the downside. And now this big rally back, we’ve never seen a rally come off the bottom like that. There’s a reason why we’re seeing things that we’ve never seen before.
Part of it has to do with the fact that there is a gambling mentality in the market. You have money chasing money chasing money. So you have money chasing action. So stocks that have been hot get hotter, stocks that have been cold get colder until that shifts and inevitably that always shifts. But for the moment the gambling wins out. We saw that in late 2021. was quite obvious when you had all the specs that were doing the crazy things. You the ICOs doing the crazy things. had, what is it? The yacht club monkeys or whatever it was that were going crazy on price action. So when you have a gambling mentality, yeah, momentum wins all the time until it doesn’t. And momentum tends to stop pretty quick.
So gambling tends to be associated more with the younger folks coming into the market. And I won’t belabor that. It’s just the nature. When you’re 20 years old, you’re willing to bet a little bit that you’re not willing to do when you’re 70 years old. So that has something to do with it. It also has to do with the market structures a little bit different now because of zero data expiration options.
Not a lot’s been written about this, not a lot’s been covered on it, but you can find all sorts of articles that talk about some of the things that are happening in the market right now directly as a result of it. When you have, I think I read this week, 68% of all the S&P option contracts are zero day to expiration options, meaning folks who are trading, 68% of those contracts that traded today are going to expire today.
That is pure gambling, right? I mean, we’re not doing a fundamental valuation and saying, yes, the S&P because of this and this and this ought to close at this. We’re just making a bet the S&P is going to close at this level or above or this level or below. We’re going to trade based on that.
If you look at where the S&P has closed every day the past couple of weeks, you’ll find that the SPY has closed at or near the strike price with the largest number of options outstanding, and the largest volume of options traded for that day. That’s also true of the S&P500 index options that are zero day at expiration as well. So there’s these sell side of that, the contra trade, the sellers of those options have a vested interest in making sure that that S&P closes near that strike price. make the most money on that. So it’s not a coincidence.
And it’s usually the folks kind of like if you play poker, it’s the guy with the biggest stack that has the better chance of winning. Well, on Wall Street, it’s the friend with the largest amount of money that has the best chance of winning. And when you have a low volume environment, which is what we have typically during the summer months, a low volume environment and somebody with a big stack, they can push prices around. And when you have two stocks, Nvidia and Microsoft making up a large percentage of the S&P 500 index. 10 % or 10 stocks make up 40 % of the index.
You can push those stocks around and you can target a price. Not saying that you can do that in an efficient market where there’s a lot of action, a lot of activity, but in a low volume environment, you can do that. And I think you’re seeing some of that. And I’m not putting a conspiracy hat on or anything else. This sort of stuff happens often.
Folks with big amounts of money are able to push prices around a little bit. You see it all the time. And I think we are seeing some elements of that. So we’re seeing elements of gambling and we’re seeing elements of, you know, the function of the market has changed a little bit because of zero to eight expiration options. My job is to recognize that that’s what’s happening and to make recommendations accordingly.
So I can’t, you know, even if I’m bearish, I can’t sit here and say, hey, let’s, let’s short a whole bunch of stocks here because right now, the momentum and the guys with the option power and the big stacks are betting on it moving higher. So I can’t do that yet. There will come a time where that bet is shifted and it goes the other way and it’ll make sense to do it. But right now, I go back to how we started this podcast off.
I’m happy to sit with cash on the sidelines. You know, I’m sitting in my money market fund, I’m getting 4%, 4.1%. It’s not fantastic, but I’m risking zero to do that. And my biggest concern with the market is the higher we go, the more those valuations get stretched, the more gambling takes over the thought processes in the market, the more vulnerable we come to a rug pull. And a rug pull happens very quickly. And we’ve seen it before. And I’m always, you know, I’m grandma on the beach telling everybody to wear your sunscreen. But at some point, you’re going to say, you know, I’m glad somebody came up with and said, wear the sunscreen because you’re going to get burned otherwise.
Rachel: It’s a really great image, Jeff. Thank you. But of course, for young people, we have the most access to markets that people have ever had ever just in our pocket with phones, right? Nobody’s out there saying, no, you have to learn how to do this thing. It’s just two clicks. And just, for most people, I’m sure it doesn’t even seem like real money.
And of course, there’s got to be a gambling mentality that goes with that, and until everything comes crashing down and all those young investors learn their lesson.
Jeff: Well, you thought, I mean, you got a glimpse of it in 2021, right? In 2020 and 2021, the government was sending everybody all these stimulus checks and the young people would sit in their parents’ basement and trade stocks and gamble with their COVID relief money. And then we saw what happened in 2022. I don’t want to say we’re headed for something similar, but I think we are.
Rachel: It feels like it.
Jeff: That’s what comes from this type of environment and this type of mentality. Eventually everything comes home to roost.
Rachel: Absolutely. Well, Jeff, I’m going to speak on behalf of probably all of our subscribers and say thank you for telling us to put on the sunscreen and put down the ice cream. And we’ll see what the few months have in store for us. Thank you.
Jeff: Awesome. Thanks everybody for watching.