

Listen to the audio version of this article (generated by AI).
Managing Editor’s Note: Today, we’re hearing from our contributing editor Mike Burnick in his weekly feature.
Mike has over 30 years in the investment and financial services industry – from operating as a stockbroker, trader, and research analyst, to running a mutual fund as a registered investment advisor and portfolio manager, to being Research Director for the Sovereign Society, specializing in global ETF and options investing.
And he’s been senior analyst at TradeSmith for three years, running Constant Cash Flow, Infinite Income Loop, and Inside TradeSmith.
Here’s Mike…
BY MIKE BURNICK, CONTRIBUTING EDITOR, MARKET MINUTE
The cycles found in nature, such as the seasons of the year and phases of the moon, are an irresistible force. Every month we’ll see a full moon… It’s a naturally repeating pattern.
And cycles and seasonal influences apply to financial markets.
For instance, the stock market has bullish seasonality from November through January. Perhaps not every single year, but historically this is true more often than not.
Stocks also have bearish seasonality, which is kicking in now.
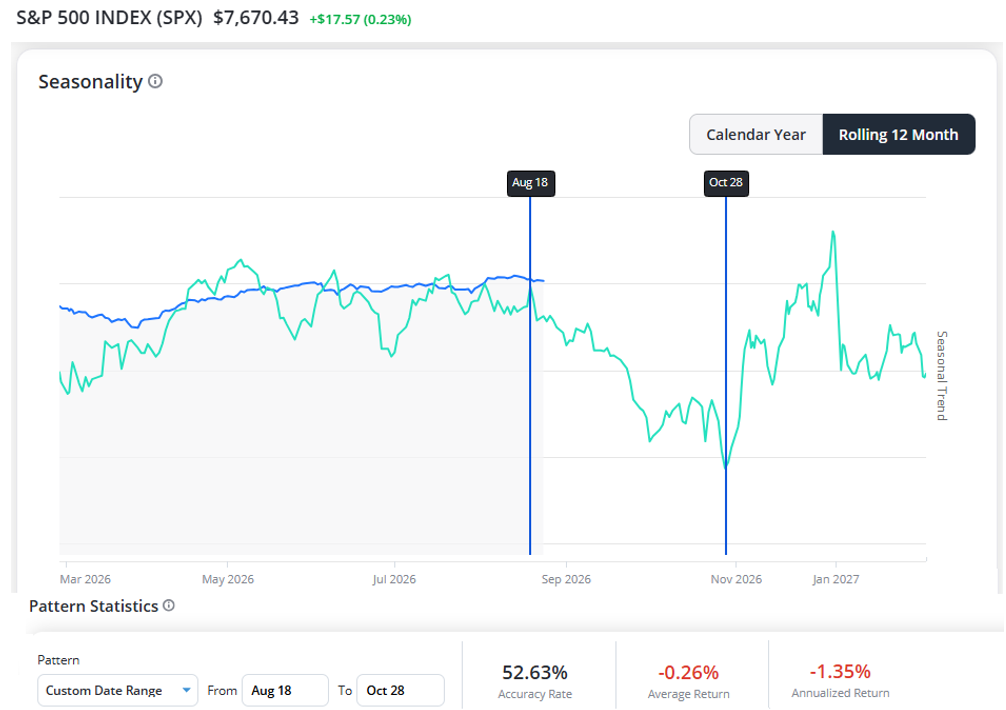
As you can see from our Trade Cycles chart above, the S&P 500 just started a seasonal period that has produced poor results historically.
From late August through October, stocks are up just over 50% of the time, with the S&P 500 delivering negative annualized returns of -1.35% over the past 75 years.
September starts next week and historically it’s been the worst month of the entire year to own stocks.
Again, not every year. Last September the S&P 500 gained 3.5%. Over the long run however, September stock market losses have outpaced gains.
But that doesn’t mean everything heads south at this time of year.
And you can use our Trade Cycles Calendar to spot investments that typically buck the down trend in stocks.
TradeSmith subscribers can access this valuable seasonal data by clicking on More from the main menu bar, then on Calendar. This will land you on our Market Calendar page, which includes many upcoming market events, including earnings, stock splits, dividend dates and much more.
Next to Market Calendar, click on Trade Cycles Calendar.
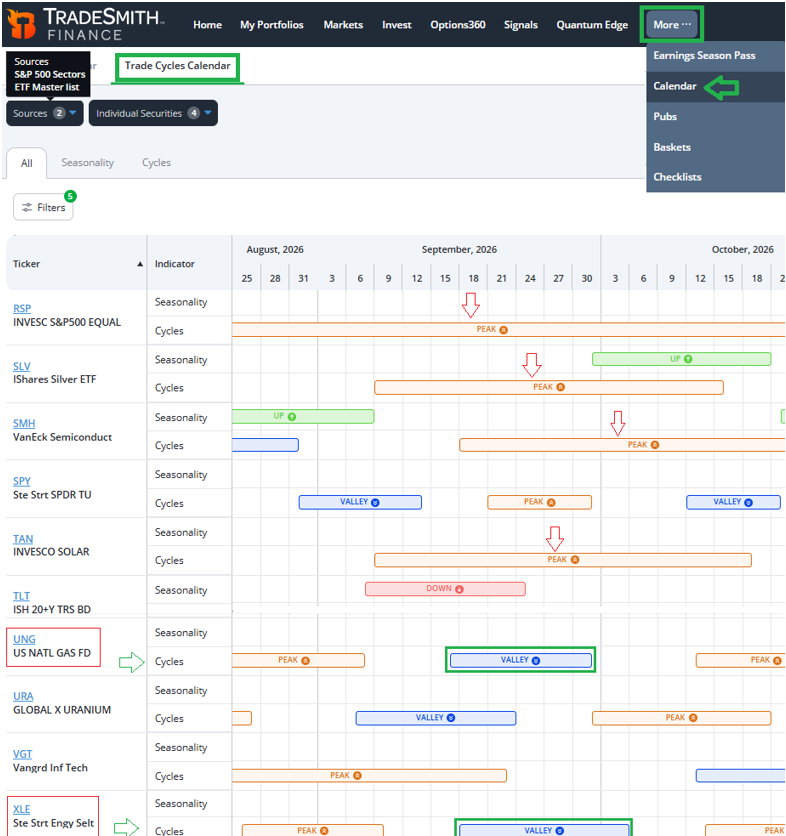
Next, under Sources, I selected S&P 500 Sectors and our ETF Master List. This will screen for ETFs that have bullish Seasonality or Valley Cycles during September-October.
As you can see, most asset class ETFs are at Peak Cycles during this typically poor seasonal window, but a few ETFs stand out as bullish.
Both the US Natural Gas ETF (UNG) and Energy Sector ETF (XLE) are approaching Valley Cycles in mid-September that continues into October. It tells you these ETFs are likely to turn higher, beginning new uptrends during this period.
Despite the overall bearish stock market Seasonality at this time of year, energy stocks and ETFs have a bullish tendency to buck the trend and move up.
Bottom line: Our Trade Cycles indicators can help you pinpoint bullish or bearish seasonal periods that have consistently repeated over the years. And using the Calendar feature, you can easily spot the exact days when stocks and ETFs are likely to turn higher or lower in price.
Good investing,

Mike Burnick
Contributing Editor, Market Minute