
Listen to the audio version of this article (generated by AI).
Managing Editor’s Note: Today, we’re hearing from our contributing editor Mike Burnick in his weekly feature.
Mike has over 30 years in the investment and financial services industry – from operating as a stockbroker, trader, and research analyst, to running a mutual fund as a registered investment advisor and portfolio manager, to being Research Director for the Sovereign Society, specializing in global ETF and options investing.
And he’s been senior analyst at TradeSmith for three years, running Constant Cash Flow, Infinite Income Loop, and Inside TradeSmith.
Here’s Mike…
This Stealth Bear Market May Soon Be Over
BY MIKE BURNICK, CONTRIBUTING EDITOR, MARKET MINUTE
Lots of folks are worried that stocks are cruising for a bruising.
Just look at the multiple bearish market breadth indicators that have flashed recently.
- 75% of S&P 500 stocks are trading below their key 50-day moving averages.
- Since mid-August more stocks have declined than advanced on the New York Stock Exchange (NYSE)
- The number of NYSE and Nasdaq stocks at new LOWS has exceeded new highs for 25 straight trading days.
We haven’t seen bad breadth like this since the tariff-trauma market selloff in early 2025!
Yet the S&P 500 and Nasdaq 100 just notched new all-time highs this week.
So, what gives?
Let’s call it a stealth bear market … which it has been for most of the S&P 500 – outside of a select few stocks.
Over half of S&P 500 stocks are down 20% or more this year. That’s the technical definition of a bear market.
But it doesn’t matter, because the heavy hitters at the top are doing almost all the work for the indexes. Just eight stocks accounted for 60% of the upside move in the S&P 500 since the March low.
- Nvidia
- Apple
- Microsoft
- Micron
- Alphabet
- Advanced Micro Devices
- Amazon
- Meta Platforms
But the lopsided market breadth indicators got so negative that it’s positive!
Market breadth is even more oversold now than at the March bottom – a 10% decline for the S&P 500.
That means the worst of the selloff for “average” stocks may soon be over, if it isn’t already!
And the really good news is that the fourth quarter of 2026 is now underway and historically, it’s been a great time to be invested.
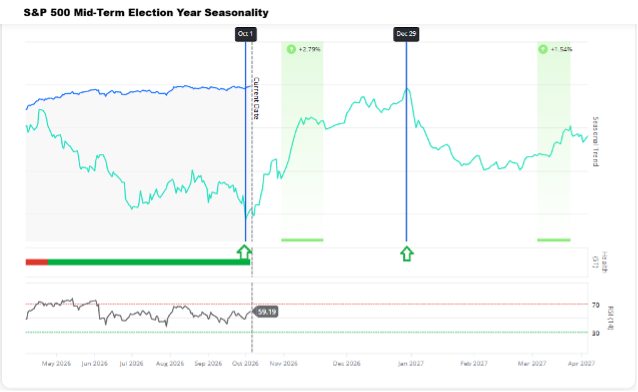
As you can see in this Trade Cycles Seasonality chart, the S&P 500 jumps an average of 6.5% from October through December in midterm election years. That’s more than double the 2.9% average return across all other years.
The stock market has taken some strange twists and turns this year.
But the next act is likely to see the “average” stock play catch up in performance with the mega-cap tech stocks that have been doing all the heavy lifting lately.
And this bullish seasonal period we’re now in would be just the right time to see this kind of market shift.
Good investing,

Mike Burnick
Contributing Editor, Market Minute