

Listen to the audio version of this article (generated by AI).
Managing Editor’s Note: Today, we’re hearing from our contributing editor Mike Burnick in his weekly feature.
Mike has over 30 years in the investment and financial services industry – from operating as a stockbroker, trader, and research analyst, to running a mutual fund as a registered investment advisor and portfolio manager, to being Research Director for the Sovereign Society, specializing in global ETF and options investing.
And he’s been senior analyst at TradeSmith for three years, running Constant Cash Flow, Infinite Income Loop, and Inside TradeSmith.
Here’s Mike…
Gold and Silver Look Set for a Seasonal Rally
BY MIKE BURNICK, CONTRIBUTING EDITOR, MARKET MINUTE
After notching record highs above $5,500 an ounce early this year, gold has dropped over 25%.
Jeff and I have both been waiting for an opportunity to buy back into gold stocks, and it looks like our patience is about to pay off.
Two key technical indicators are diverging positively for gold. Meanwhile, gold mining stocks are now in an optimal seasonal window, according to our Trade Cycles indicators.
Let’s take a closer look.
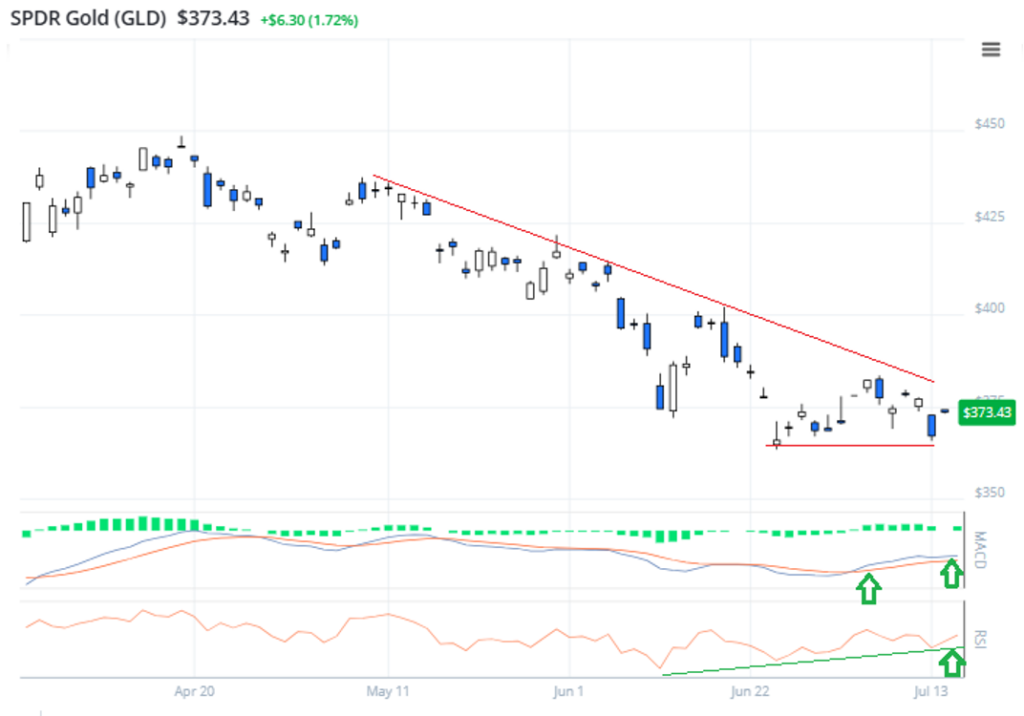
In the chart of the SPDR Gold ETF (GLD) above, you can see gold remains in a downtrend, but it’s formed a flat base recently.
At the same time, notice how positive divergences have shown up in the MACD and RSI indicators. Both of these technical indicators are moving higher while the price of GLD is flat.
That’s a bullish divergence that tells me momentum is building in GLD for a possible upside breakout!
Turning to gold mining stocks, take a look at the bullish seasonal pattern in the SPDR Metals & Mining ETF (XME) below.
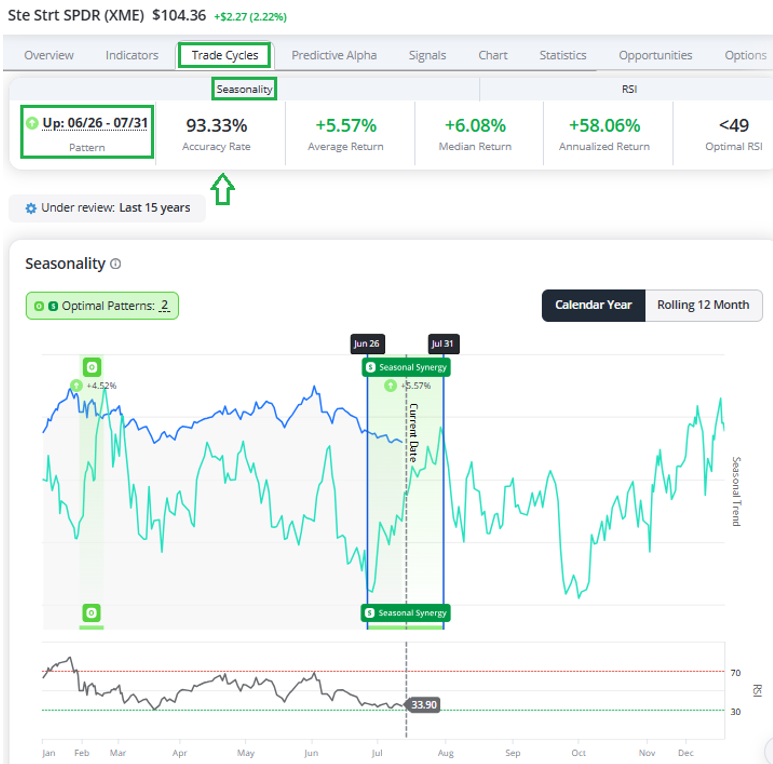
As you can see, XME is now in an optimal seasonal pattern, according to our Trade Cycles indicators.
This is based on our decades of analysis into historical price data and seasonal market trends. Subscribers can access these indicators by clicking on the TradeSmith Finance Home page, then scrolling down to Seasonality.
Our system flags consistently recuring patterns that can give you an edge in your trade timing. That’s exactly what we’re seeing in XME right now.
XME has moved up 93.33% of the time between June 26 and July 31 over the past 15 years, while posting average gains of +5.57% and median returns of +6.08%!
Trading XME only during this bullish seasonal pattern delivered annualized gains of +58% historically!
Bottom line: Our Trade Cycles Seasonality tools help you pinpoint dates when certain assets consistently trend higher. And right now, it’s telling me gold mining stocks are set for a seasonal rally. Combine that with positive divergence in MACD and RSI and you have the recipe for a winning trade.
Good investing,

Mike Burnick
Contributing Editor, Market Minute
P.S. If you’re interested in exploring these types of tools, how they can help take the guesswork out of the markets and maximize your returns, make sure you sign up for the Breakthrough 2026 event at 10 a.m. ET today.
Tradesmith CEO Keith Kaplan will walk you through how we uncovered these patterns, why they persist even in chaotic markets, and how you can use them to guide real-world trading decisions.
More important, I’ll be also getting into detail about the fast-approaching seasonality patterns you need to be aware of.
Knowing when the windows are opening and closing likely matters more to your wealth than any single decision you’ve made.