
They’re probably the most satisfying trades I’ve ever made.
At the height of the COVID lockdown, my wife and I realized we desperately needed more exercise.
So, like millions of others, we decided to buy a Peloton bike.
But unlike millions of others, I didn’t pull the $4,000 I needed out of my checking account. Instead, on Feb. 5, 2021, I made four trades that generated more than that amount in instant income.
My wife was stunned. And I was hooked.
The type of trade that “bought” us a Peloton quickly became my favorite way to generate income in the stock market – and still is to this day.
And it was made relatively stress-free thanks to a software innovation from TradeSmith. It rates the best short-term income opportunities so you can stack the odds in your favor.
As you can imagine, it’s been a big hit.
One user, Ian W., wrote in to say he made $600 a day with this strategy…
Another, Mark C., tells us he made $15,000 over the first seven weeks of this year…
And Marion B. says she made between $5,000 and $10,000 a month using this strategy…
I’ll get into how this software innovation works in a moment. I’ll also introduce you to a TradeSmith breakthrough that makes it even more effective.
First, I want to share some of my early frustrations as a trader and how they led me to develop these tools.
Two Steps Forward, One Jump Back
I came to TradeSmith about eight years ago. Back then, our only software was TradeStops.
It answered a critically important question: When do you sell a stock to lock in gains and avoid a ruinous loss? And it’s as great today as it always has been at helping you manage your downside risk.
But I wanted to solve a problem TradeSmith hadn’t tackled – one that customers were constantly writing to us about.
They were happy that TradeStops helped them manage their risk on stocks they already owned. But they wanted us to also develop strategies that would help them spot new opportunities to profit.
This involved buying a lot more data, creating new algorithms, and writing tens of thousands of lines of code. It wouldn’t be easy. But it meant solving one of the biggest problems our customers faced. So it became the obsessive focus at meetings about our software roadmap.
And my frustrations as a trader helped us figure out how we should execute on our plan.
You see, I used to run into an issue I call “two steps forward, one jump back.” It went something like this…
I’d make a respectable profit on a trade. I’d bank the cash and start hunting for the next opportunity. I was happy but humble. I knew the next trade might not go my way.
Then a new opportunity would come along and – lucky me! – I’d win again.
That’s when greed would start to creep in. “I’m on a hot streak,” I’d think to myself. “I should go bigger next time.”
You can probably guess what happened next…
I’d make my next trade, risking more of my account than before – maybe even more than the last two trades combined. Then that trade would turn against me, and I’d be back to where I started.
I was doing a lot of work for no result. It was a waste of time and energy. I had to find a way to put the odds on my side – or at least know what the odds were to begin with.
So along with my team of coders, quant investors, and data scientists, I built a software solution.
Monumental Challenge
It was a monumental challenge. It was so complex that colleagues laughed at me when I told them what we were doing.
Even my close friend and mentor Dr. David Eifrig – a former elite derivatives trader at Goldman Sachs – told me it couldn’t be done.
He had a good point…
To generate income from trading, you “insure” other investors by selling them options contracts. In return, you pick up a kind of insurance premium – an upfront cash payment that goes straight into your brokerage account.
So, to build our new software tool, we needed billions of rows of options pricing data. We also needed to make millions of database queries to constantly update those prices.
And the options market has so much more data than the stock market. At times, this made the challenge feel insurmountable. But eventually we got there.
We built massive databases and algorithm after algorithm. And we created an indicator that helped me and other TradeSmith users generate thousands of dollars of trading income while keeping our risk under control.
We call it the Probability of Profit (PoP) indicator. As the name suggests, it helps you see the probability of success for these income trades under your own defined conditions.
With this tool, you can see the statistical likelihood of a stock hitting a certain target price by a specific date. This allows you to make more intelligent trades by lowering the likelihood of a “jump back.”
We debuted the PoP in 2021, and in the past couple of years it’s helped our Constant Cash Flow model portfolio achieve a 98.8% win rate on more than 900 income trade recommendations.
But as impressive as that is, my team and I haven’t been resting on our laurels. We’re on a mission to help regular investors level the playing field with Wall Street with elite software tools. And we’ve been building a new tool to work alongside the PoP to give you even better results.
We call it the Thorp Line – or T-Line for short – after leading probability theorist and pioneering “quant” fund manager Ed Thorp. And it redefines how everyday investors can generate cash in the market.
Introducing Our T-Line Innovation
Thorp is a fascinating guy.
In the 1960s, he figured out how to win at blackjack by using card-counting techniques he pioneered in his best-selling book Beat the Dealer.
He also built one of the world’s first wearable computers with Claude Shannon – the MIT mathematician now known as the “father of information theory” – to tilt the odds in roulette.
Later in his career, Thorp figured out how to identify when investors were mispricing options trades. This made it possible for him to profit from that gap – no matter if the market was going up or down.
He did this over and over again at his Princeton/Newport Partners fund. Over 30 years, it returned fivefold higher gains than the S&P 500, turning every $10,000 into $283,400. Even more remarkable, Thorp’s fund only had three down months in 20 years – and each was less than a 1% loss.
Here’s a view of what the T-Line does.
See those green dots below the line and those red dots above the line? They represent market mispricings of options contracts:
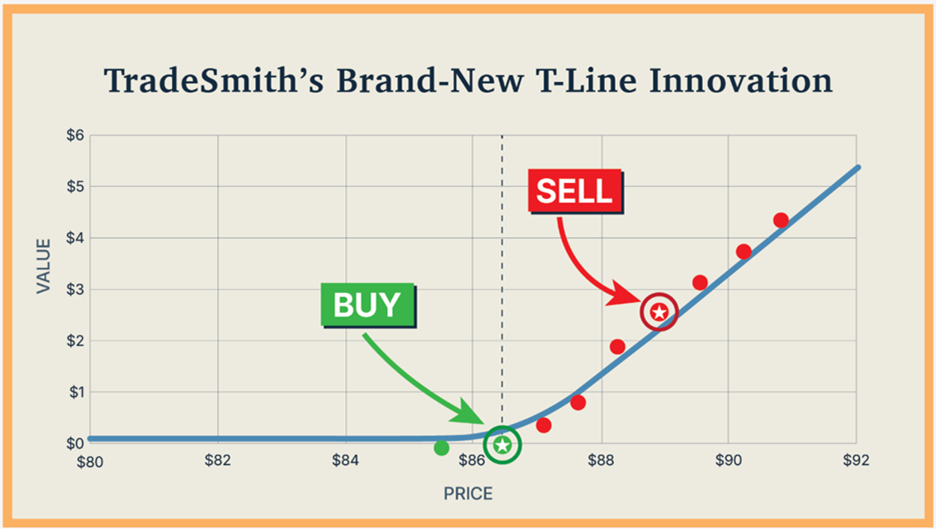
If I want to generate upfront cash using my favorite trade, I look up any options contract on virtually any stock and see which of the dozens of possible trades I could make by arranging them either above or below the line.
The line is fair value. The dots are different potential options trades. The farther away from the line a dot is the greater the gap between price and fair value… and the higher your potential gains.
Green dots are opportunities to buy options and profit as stocks move. Red dots are opportunities to sell options and pick up premium income.
Just like with buy-and-hold investing, the bigger the gap between price and fair value, the better. That’s what those green and red dots with stars in them represent.
This is a simplified illustration to give you a flavor of how the T-Line works.
I covered more detailed examples during the T-Day Summit.
I showed how the T-Line works and how you can use it to generate your own extra income streams by combining it with the PoP. I also showed some real-world trades you could make right away.
If you’re one of the nearly 3,000 people who joined me live, thank you! I hope you left with a better grasp of how to make these kinds of trades for your own account. Maybe you’ll even join Ian, Mark, and Marion and start generating extra income this way.
And if you missed the summit, don’t worry. You can take a closer look at these tools right here.
They could change the way you trade – just as they did for me and thousands of other investors.
All the best,
Keith Kaplan
CEO, TradeSmith
P.S. It’s not just Thorp’s track record that I find inspiring. Like me, he was also an outsider who beat Wall Street at its own game.
Thorp started out as a mathematician who wanted to test his theories as a blackjack player. I’m a software engineer. The Ivy League brigade on Wall Street have always looked at me with suspicion. And that’s fine.
You may be able to relate. Maybe you weren’t born with money. Maybe you didn’t go to private schools or hang out in country clubs. Maybe you didn’t start investing until later in life. That’s okay, too.
When you are an outsider, you stop asking for life to be fair and figure out how to create your own edge instead. And you figure out how to beat the systems you don’t control.
That’s what we’ve done with the PoP and the T-Line. We’ve made these hedge-fund-level tools available to everyone – no matter what your background or your net worth. Check out how they work here.