
Stocks performed well last year, with the S&P 500 Index ending up more than 16% in 2025. That’s the third straight year of double-digit gains for the stock market.
However, those gains came with a fair share of volatility.
Stocks crashed nearly 20% early last year due to tariff concerns. But the market soon had a reversal of fortune to the upside.
This kind of volatility may be the roadmap for 2026 as well, according to our TradeSmith Trade Cycles indicators. In fact, with the new year less than a week old, we’ve already seen it, driven by uncertainty about Venezuela.
That’s why I always perform a new year “check-up” with our proven Trade Cycles Seasonality indicators…
Trade Cycles is designed to identify periodic, repeating patterns in stock market prices and combines this with other indicators to help predict upcoming trends for the major indexes, plus individual stocks, ETFs, options, and even cryptocurrencies.
Trade Cycles can help you more accurately time your entries and exits, and acts as an “odds enhancer” when combined with other indicators.
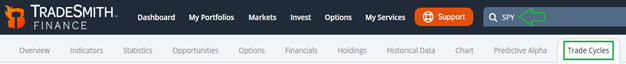
To easily access Trade Cycles from TradeSmith Finance, subscribers can simply enter any symbol in the Search for Ticker box on the main menu, in this case SPY – SPDR S&P 500 ETF (above) – then click on Trade Cycles.
(Note that your access will vary depending on your TradeSmith subscription level.)
Here you’ll find the current Trade Cycles Seasonality Annual Pattern displayed, as shown below.
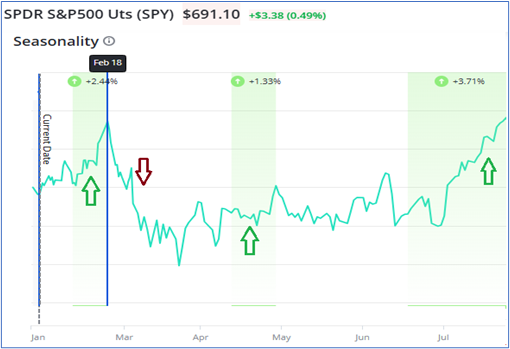
As you can see above, SPY is in the midst of a bullish seasonal pattern right now. It’s set to possibly accelerate higher into mid-February.
By March however, a market pullback is indicated (red arrow). Then a choppy trading pattern is indicated for April and early May.
Finally, another seasonal uptrend emerges in June-July, which has historically produced average gains of 3.7%.
That’s the seasonal roadmap for the first half of 2026 according to our Trade Cycles Seasonality tools. Just keep in mind that these seasonal patterns don’t always repeat exactly.
So, don’t take this as gospel, but as a gauge of the likely market trend based on history.
Also, be sure to frequently check the TradeSmith Market Outlook page (under the Markets tab) on our website to see the current health distribution for the stock market indexes and sectors.
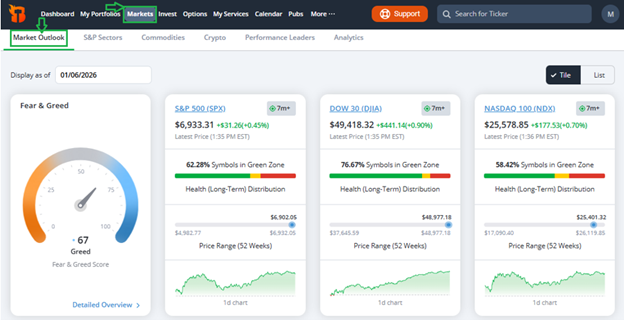
Bottom line: TradeSmith indicators like our Trade Cycles Seasonality and Market Outlook can give you valuable clues about the likely timing and trend shifts for individual securities and the market. And these insights can help you more accurately time your entry and exit points well in advance of the stock markets twists and turns.
Good investing,

Mike Burnick
Contributing Editor, Market Minute